Lawes1991
This report is generated for performance of Chickpea model in APSIM NG for experiment Lawes1991.
Experiment Information
The experiment specific information is provided in the memo of apsimx file.
) Gatton RS 1991, 2 sowing date experiment. Creek bank soil is highly variable.
Peter Carberry upublished data. Also known as APS2??
Current version of the model seems to be starting grainfill too early for this data. May have been a waterlogging stress that delayed flowering? Or do modern cultivars set seed faster than Amethyst?
Cultivars
Performance
Overview
The table below summarizes the performance of APSIM NG for all cultivars across experiment Lawes1991.
Lawes1991
| trait | n | r | r2 | bias | mse | rmse | nrmse | d |
|---|---|---|---|---|---|---|---|---|
| AboveGround.Wt | 12 | 0.37 | 0.14 | 207.43 | 169685.72 | 411.93 | 0.81 | 0.64 |
| Grain.Size | 2 | -1.00 | 1.00 | -0.15 | 0.02 | 0.15 | 1.24 | 0.03 |
| Leaf.LAI | 8 | 0.73 | 0.53 | 0.25 | 0.84 | 0.92 | 0.47 | 0.85 |
| Leaf.Live.Wt | 10 | 0.61 | 0.37 | 41.79 | 5488.11 | 74.08 | 0.63 | 0.72 |
| Leaf.SpecificArea | 8 | 0.54 | 0.29 | 468.66 | 29250492.81 | 5408.37 | 0.32 | 0.55 |
| Stem.Live.Wt | 10 | 0.08 | 0.01 | 148.38 | 42317.27 | 205.71 | 1.00 | 0.49 |
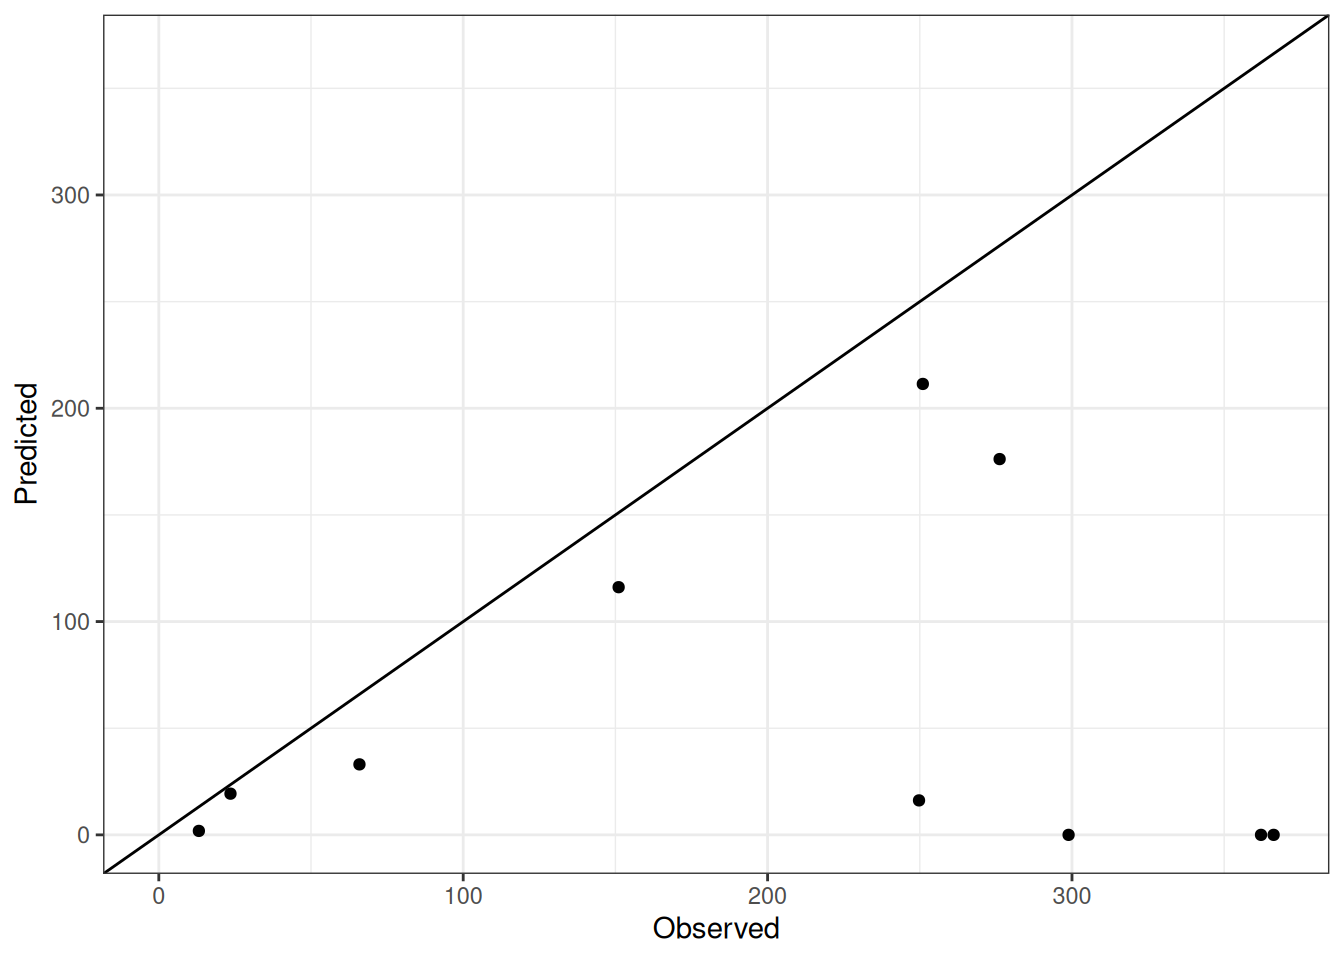
Comparison of observed and predicted values
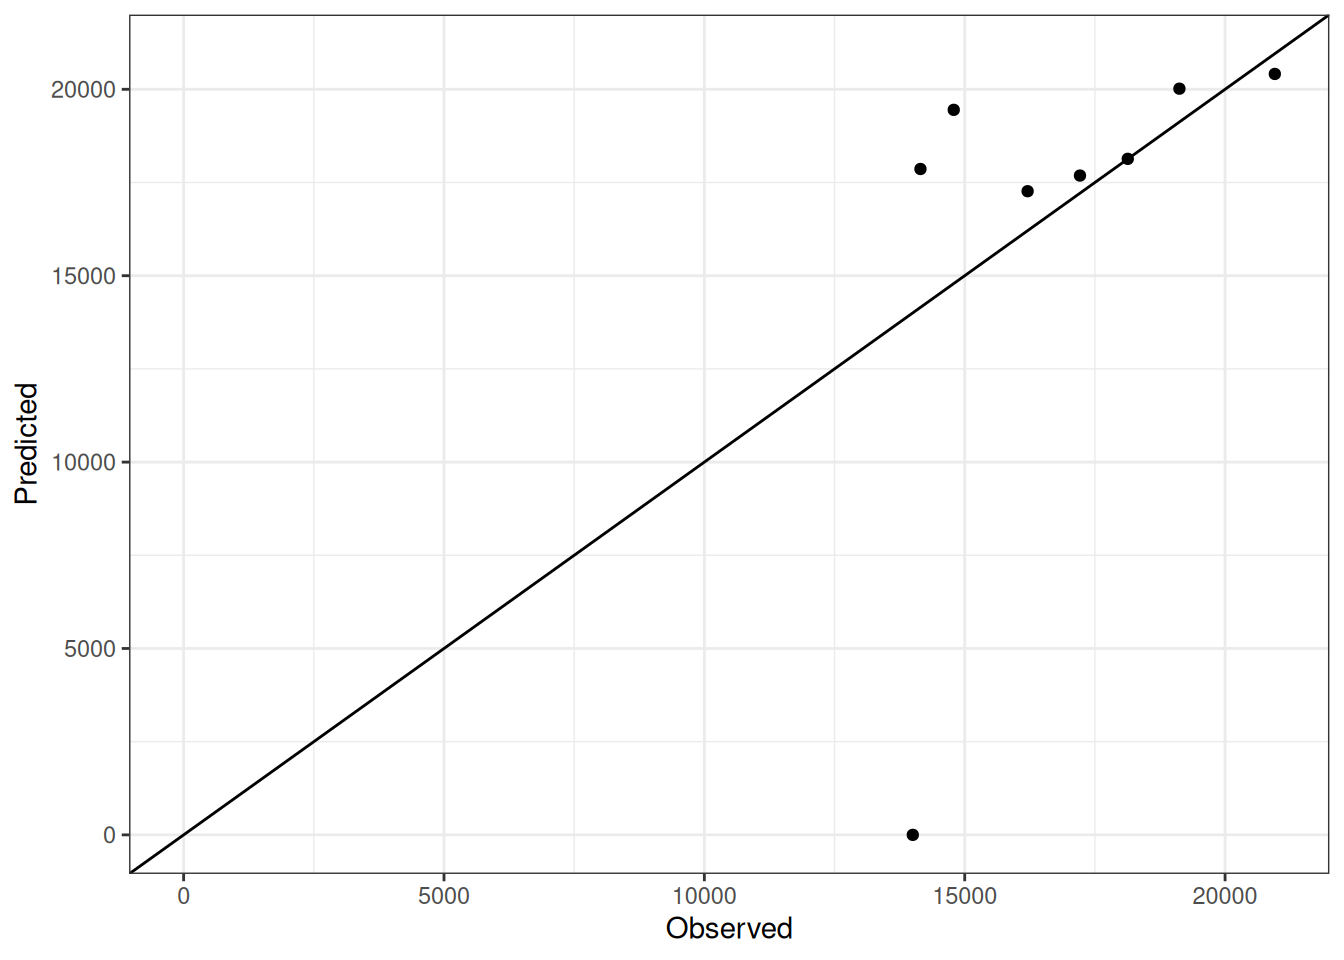
The model performance is compared with observed and predicted values for all cultivars across experiment Lawes1991. The plots below show the observed vs predicted values for different traits. Each point represents an observation from an experiment. The closer the points are to the diagonal line, the better the performance of the model for that trait.
The range of observed and predicted values are estimated using data in this page, which may be misleading for the narrow ranges of observed and predicted values.
Using the Expand All and Collapse All buttons below, you can expand or collapse the sections for each trait to see the observed vs predicted plots for different traits.
NoteAboveGround.Wt
NoteGrain.Size

NoteLeaf.LAI
NoteLeaf.Live.Wt
NoteLeaf.SpecificArea
NoteStem.Live.Wt