GreenethorpePhen19
This report is generated for performance of Lentil model in APSIM NG for experiment GreenethorpePhen19.
Experiment Information
The experiment specific information is provided in the memo of apsimx file.
)Greenethorpe phenology trial:
all treatments are irrigated - “JW: For greenethorpe simulate unlimited. We tried to keep it unlimited but there would have been some stress no measure of water just applied when ever we were out there.”
they use different TOS to the other Greenethorpe trial so will be simulated separately
there are only 2 TOS for the phenology trial at Greenethorpe
only treatments without lights used
phenology measurements up until the time of flowering only are recorded
phenological stages will change in apsim as the lentil model is developed:
From AP: “For the moment:
NextGen term ‘Start flowering’ – is actually 50% budding.
NextGen term ‘End flowering’ – is actually 50% flowering.
And I haven’t yet restructured to do a start podding.”
Met file - taken from SILO (same as Jeremy Whish)
Cultivars
Performance
Overview
The table below summarizes the performance of APSIM NG for all cultivars across experiment GreenethorpePhen19.
GreenethorpePhen19
| trait | n | r | r2 | bias | mse | rmse | nrmse | d |
|---|---|---|---|---|---|---|---|---|
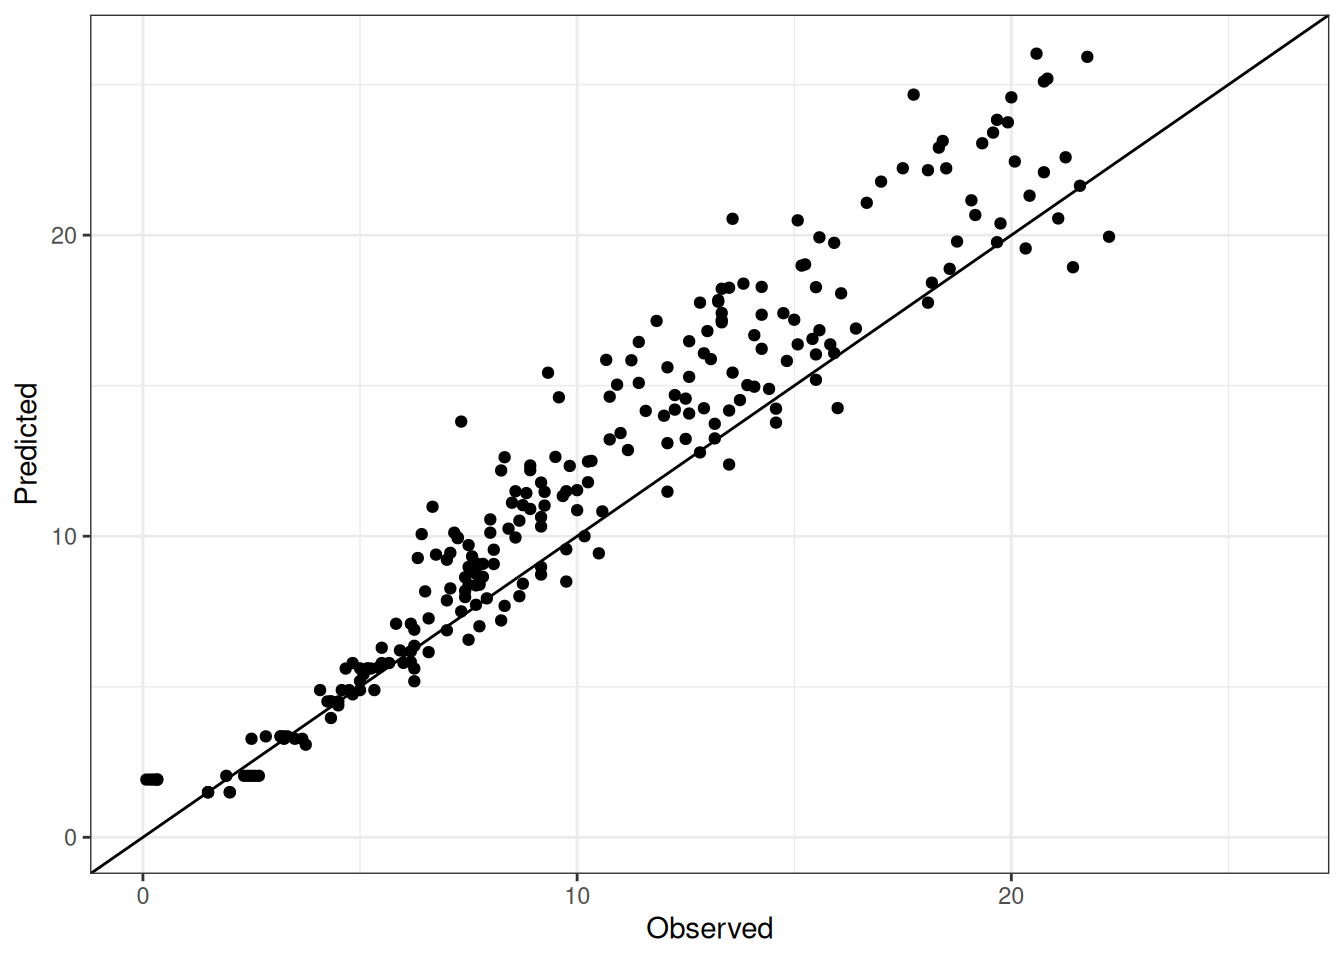
| Leaf.NodeNumber | 245 | 0.96 | 0.92 | -1.59 | 5.93 | 2.44 | 0.24 | 0.96 |
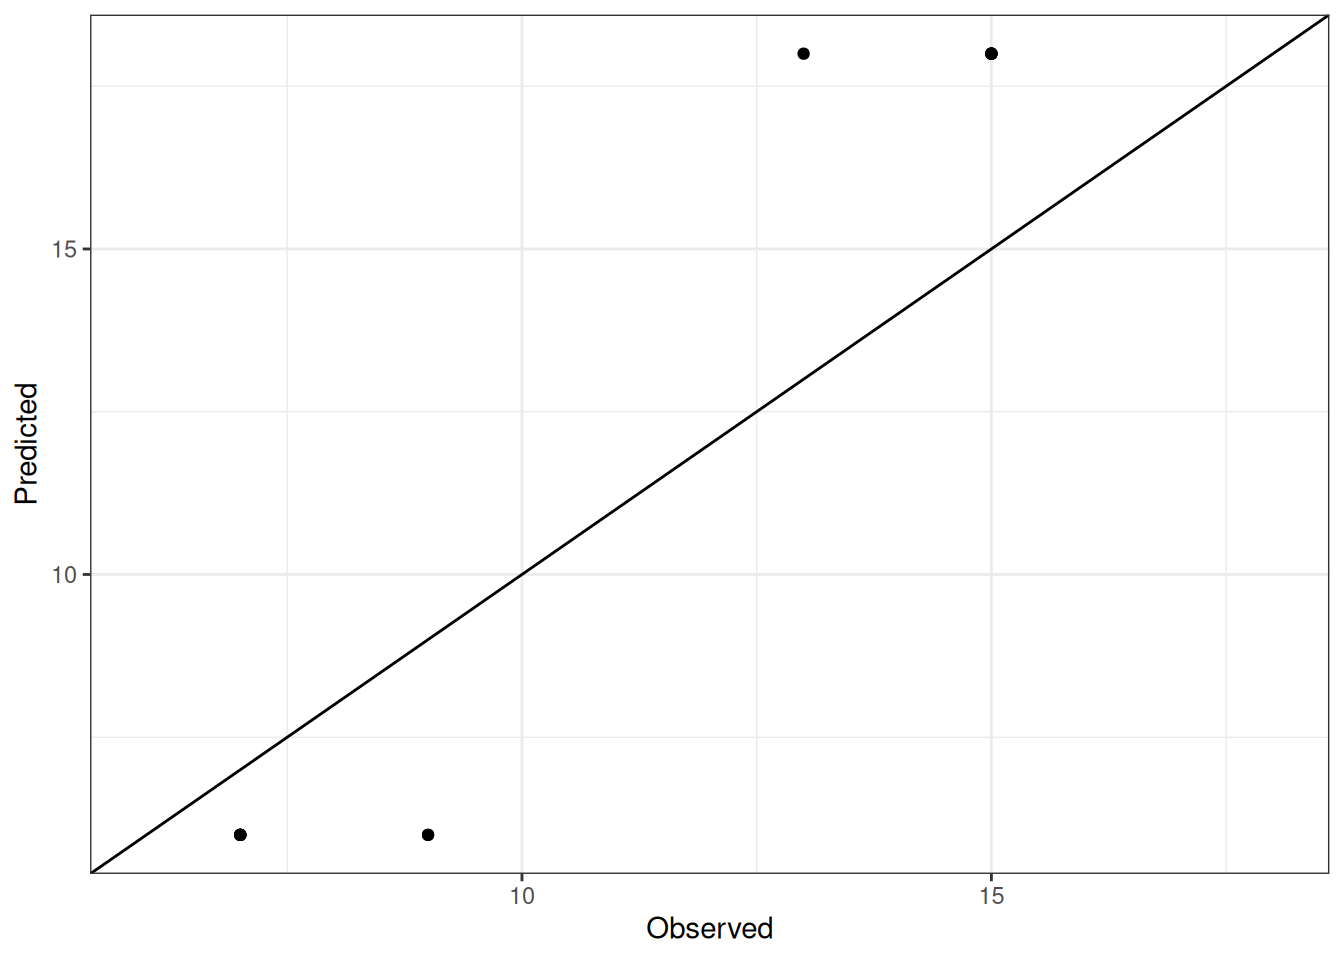
| Phenology.EmergenceDAS | 13 | 0.97 | 0.95 | -0.69 | 7.15 | 2.67 | 0.25 | 0.92 |
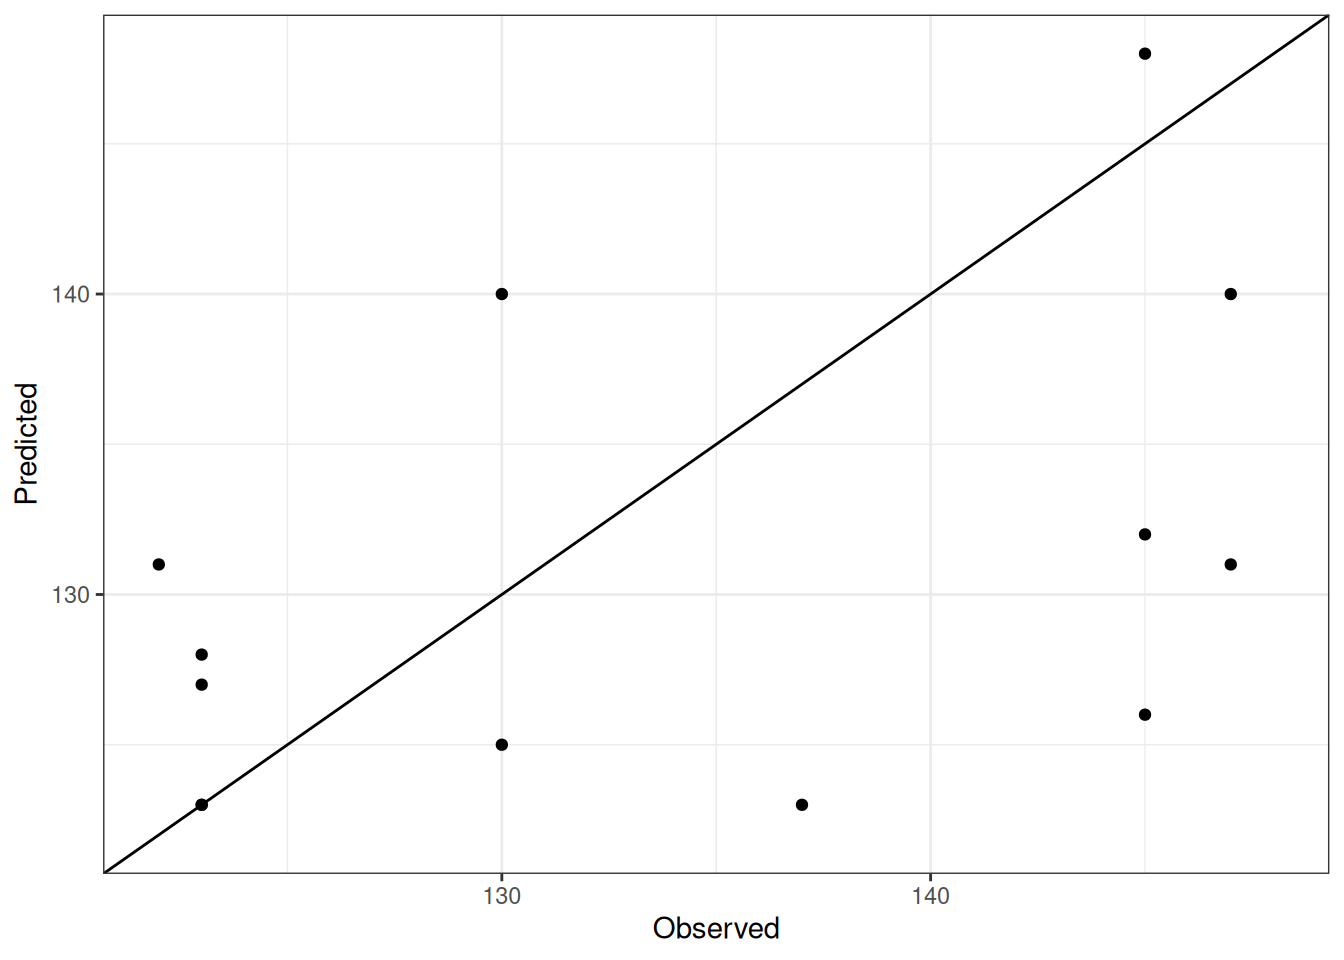
| Phenology.StartBuddingDAS | 13 | 0.49 | 0.24 | 0.69 | 169.15 | 13.01 | 0.14 | 0.69 |
| Phenology.StartFloweringDAS | 13 | 0.44 | 0.19 | -12.54 | 244.08 | 15.62 | 0.14 | 0.46 |
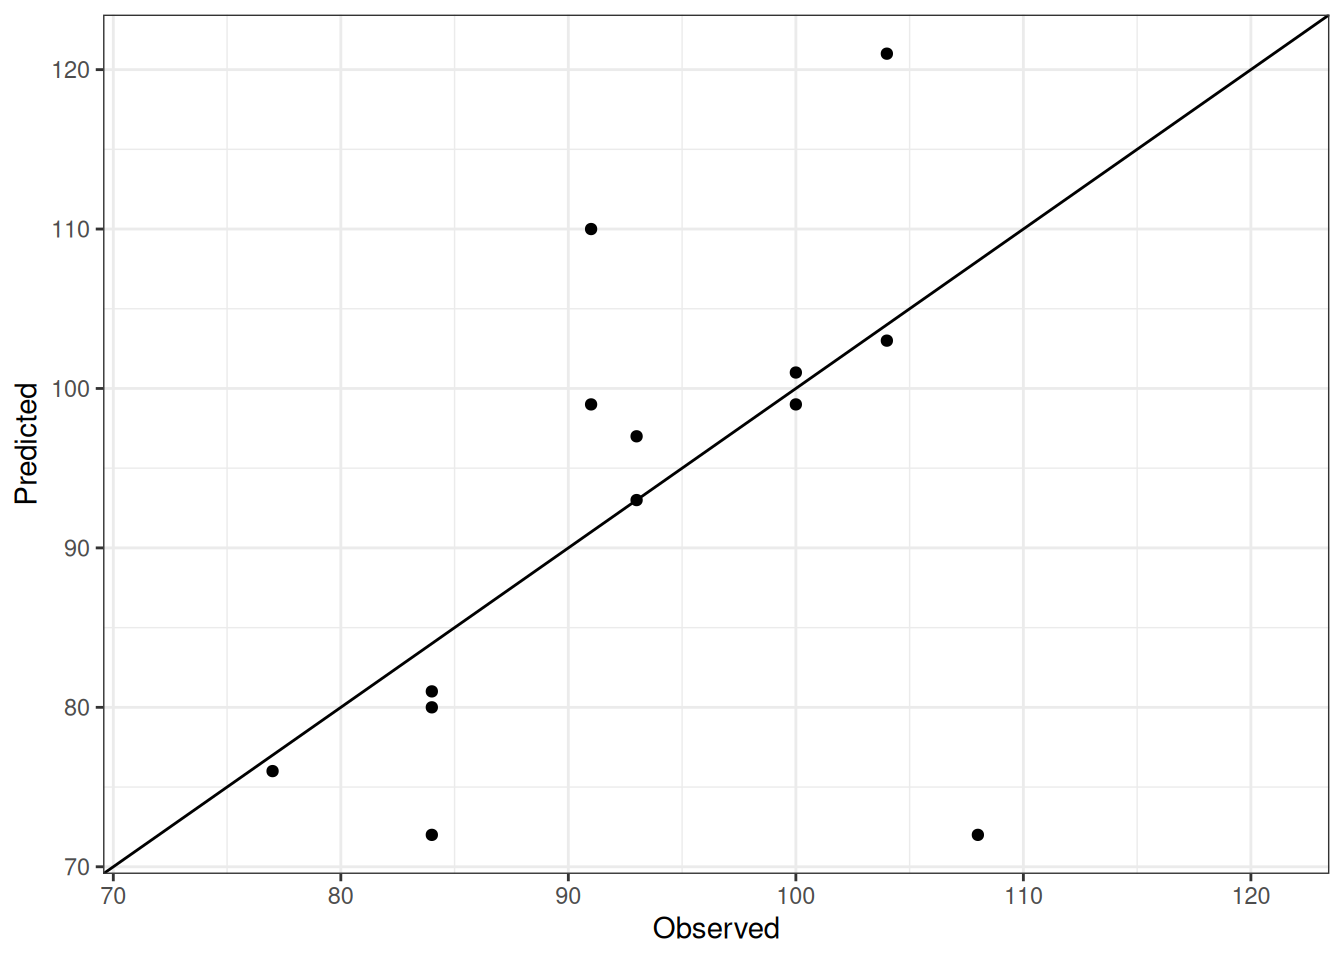
| Phenology.StartPoddingDAS | 13 | 0.48 | 0.23 | 3.31 | 99.00 | 9.95 | 0.07 | 0.68 |
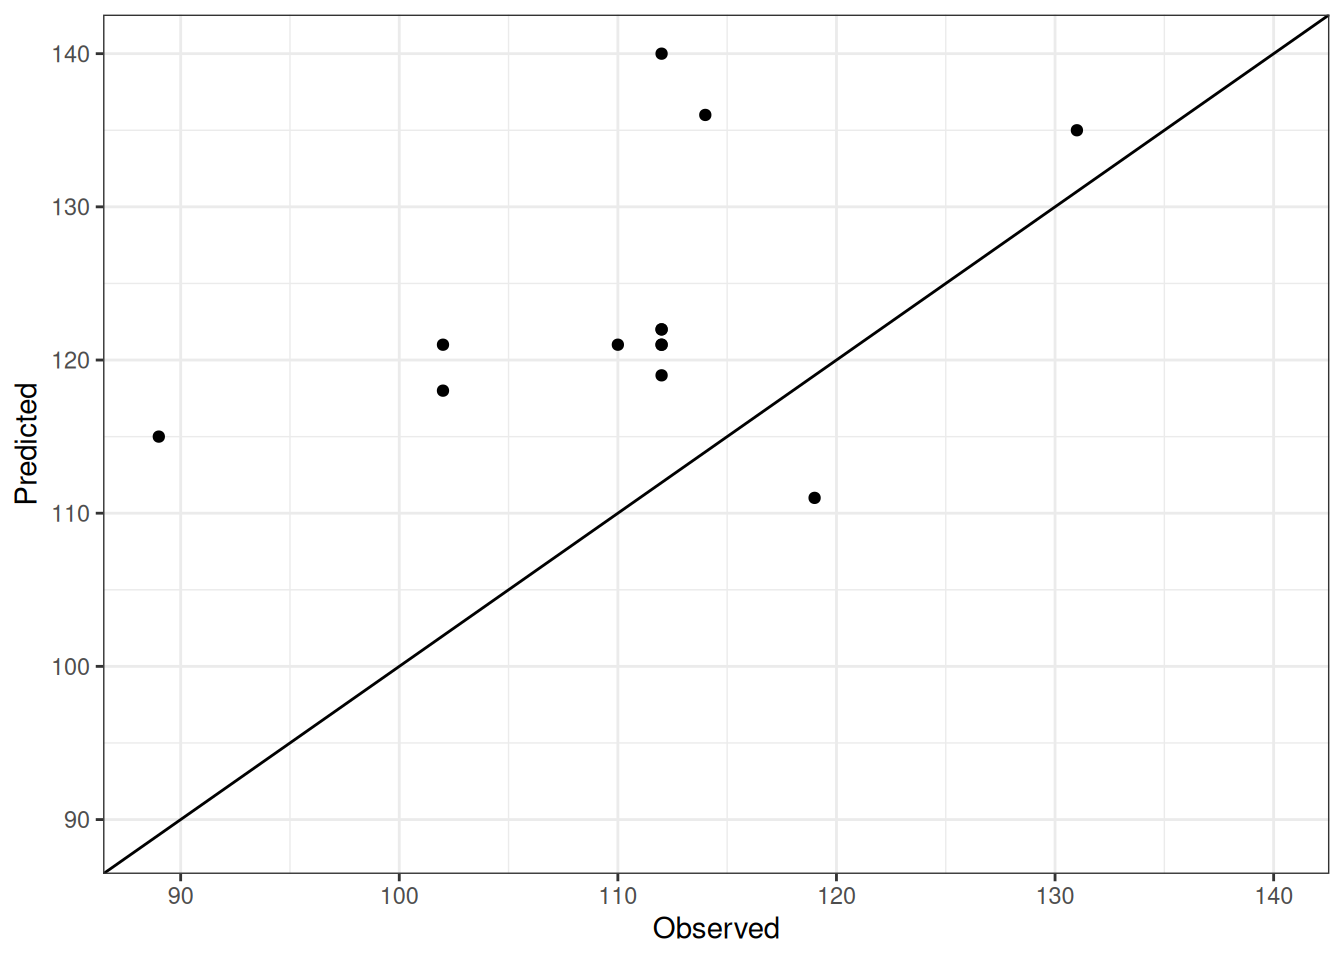
Comparison of observed and predicted values
The model performance is compared with observed and predicted values for all cultivars across experiment GreenethorpePhen19. The plots below show the observed vs predicted values for different traits. Each point represents an observation from an experiment. The closer the points are to the diagonal line, the better the performance of the model for that trait.
The range of observed and predicted values are estimated using data in this page, which may be misleading for the narrow ranges of observed and predicted values.
Using the Expand All and Collapse All buttons below, you can expand or collapse the sections for each trait to see the observed vs predicted plots for different traits.
NoteLeaf.NodeNumber
NotePhenology.EmergenceDAS
NotePhenology.StartBuddingDAS
NotePhenology.StartFloweringDAS
NotePhenology.StartPoddingDAS