| Tests/Validation/Wheat/Dookie2024/Dookie2024_originalParameters.apsimx |
| Tests/Validation/Wheat/Dookie2024/Dookie2024.apsimx |
| Tests/Validation/Wheat/FAR/FAR.apsimx |
| Tests/Validation/Wheat/GxExM/GxExM.apsimx |
| Tests/Validation/Wheat/Pask/PaskExperiments.apsimx |
| Tests/Validation/Wheat/Phenology/Phenology.apsimx |
| Tests/Validation/Wheat/Wheat.apsimx |
The performance of Wheat in the APSIM NG is summarized using datasets in the validation test set in the following apsimx files.
Cultivars
Experiments
There are 427 experiments which tested all cultivars in the validation test dataset of APSIM NG. Following the link below to see the details of each experiment, including the observed and predicted values for different traits, and the performance metrics.
This map below shows the locations of experiments without controlled environments. Following the link on the marker will take you to the details of each experiment, including the observed and predicted values for different traits, and the performance metrics.
Performance
Overview
The table below summarizes the performance of APSIM NG for all cultivars across all experiments.
| trait | n | r | r2 | bias | mse | rmse | nrmse | d |
|---|---|---|---|---|---|---|---|---|
| .Wheat.Leaf.Transpiration…ISoilWater.Es…MicroClimate.PrecipitationInterception. | 1056 | 0.82 | 0.67 | -0.03 | 1.86 | 1.36 | 0.31 | 0.87 |
| AboveGround.N | 746 | 0.91 | 0.83 | -0.75 | 21.84 | 4.67 | 0.30 | 0.95 |
| AboveGround.NConc | 269 | 0.82 | 0.67 | 0.00 | 0.00 | 0.01 | 0.36 | 0.89 |
| AboveGround.StorageWt | 52 | 0.81 | 0.66 | -33.76 | 3058.02 | 55.30 | 1.30 | 0.76 |
| AboveGround.Wt | 3933 | 0.84 | 0.70 | 36.06 | 186255.45 | 431.57 | 0.34 | 0.91 |
| DaysAfterSowing | 1673 | 0.98 | 0.96 | 0.34 | 53.23 | 7.30 | 0.08 | 0.99 |
| Ear.N | 317 | 0.86 | 0.74 | -0.88 | 13.39 | 3.66 | 0.41 | 0.92 |
| Ear.NConc | 295 | 0.08 | 0.01 | 0.00 | 0.00 | 0.01 | 0.43 | 0.34 |
| Ear.Wt | 1156 | 0.95 | 0.91 | 52.53 | 23270.71 | 152.55 | 0.27 | 0.97 |
| Ear.WtProportion | 241 | 0.89 | 0.79 | 0.04 | 0.01 | 0.09 | 0.27 | 0.92 |
| Grain.N | 288 | 0.91 | 0.83 | 1.15 | 7.70 | 2.78 | 0.25 | 0.94 |
| Grain.NConc | 286 | 0.59 | 0.35 | 0.00 | 0.00 | 0.00 | 0.16 | 0.73 |
| Grain.Number | 457 | 0.81 | 0.66 | 852.05 | 24494677.29 | 4949.21 | 0.30 | 0.90 |
| Grain.Protein | 1016 | 0.17 | 0.03 | -1.31 | 5.16 | 2.27 | 0.19 | 0.44 |
| Grain.Size | 636 | 0.32 | 0.10 | 0.00 | 0.00 | 0.01 | 0.24 | 0.56 |
| Grain.Wt | 2463 | 0.40 | 0.16 | 120.59 | 147259.58 | 383.74 | 0.58 | 0.63 |
| Leaf.CoverGreen | 111 | 0.92 | 0.85 | -0.09 | 0.03 | 0.17 | 0.33 | 0.92 |
| Leaf.CoverTotal | 1580 | 0.91 | 0.82 | -0.02 | 0.02 | 0.13 | 0.17 | 0.95 |
| Leaf.Dead.N | 170 | 0.43 | 0.19 | -0.26 | 3.33 | 1.83 | 1.94 | 0.50 |
| Leaf.Dead.NConc | 150 | -0.14 | 0.02 | 0.00 | 0.00 | 0.01 | 0.98 | 0.09 |
| Leaf.Dead.Wt | 1190 | 0.62 | 0.38 | 7.74 | 5671.37 | 75.31 | 0.92 | 0.77 |
| Leaf.DeadWtProportion | 352 | 0.06 | 0.00 | 0.01 | 0.00 | 0.04 | 0.69 | 0.44 |
| Leaf.Height | 1127 | 0.00 | 0.00 | -412.34 | 371962.07 | 609.89 | 2.36 | 0.38 |
| Leaf.LAI | 1186 | 0.81 | 0.66 | -0.66 | 3.44 | 1.86 | 0.59 | 0.87 |
| Leaf.Live.N | 557 | 0.85 | 0.72 | -1.66 | 12.22 | 3.50 | 0.76 | 0.85 |
| Leaf.Live.NConc | 541 | 0.77 | 0.59 | 0.00 | 0.00 | 0.01 | 0.24 | 0.87 |
| Leaf.Live.StorageWt | 11 | 0.23 | 0.05 | 10.02 | 101.64 | 10.08 | 0.86 | 0.13 |
| Leaf.Live.Wt | 1238 | 0.87 | 0.76 | -80.10 | 16840.59 | 129.77 | 0.81 | 0.81 |
| Leaf.LiveWtProportion | 362 | 0.96 | 0.92 | -0.13 | 0.02 | 0.15 | 0.54 | 0.93 |
| Leaf.N | 30 | 0.83 | 0.68 | -1.89 | 8.26 | 2.87 | 0.75 | 0.78 |
| Leaf.SpecificAreaCanopy | 959 | 0.00 | 0.00 | 0.00 | 0.00 | 0.01 | 0.31 | 0.39 |
| Leaf.StemNumberPerPlant | 943 | 0.43 | 0.18 | 2.74 | 21.95 | 4.69 | 0.62 | 0.54 |
| Leaf.StemPopulation | 1167 | 0.27 | 0.07 | -191.50 | 971091.45 | 985.44 | 1.66 | 0.24 |
| Leaf.Wt | 939 | 0.80 | 0.64 | -56.07 | 12325.59 | 111.02 | 0.59 | 0.85 |
| Phenology.CAMP.TSHS | 136 | 0.83 | 0.68 | 0.00 | 2.18 | 1.48 | 0.22 | 0.90 |
| Phenology.CAMP.VSHS | 135 | 0.78 | 0.61 | 1.01 | 3.11 | 1.76 | 0.44 | 0.82 |
| Phenology.EmergenceDAS | 4277 | 1.00 | 1.00 | 0.00 | 0.06 | 0.25 | 0.02 | 1.00 |
| Phenology.FinalLeafNumber | 877 | 0.88 | 0.78 | 0.34 | 2.41 | 1.55 | 0.15 | 0.94 |
| Phenology.FlagLeafDAS | 1147 | 0.97 | 0.94 | -2.22 | 105.64 | 10.28 | 0.10 | 0.98 |
| Phenology.FloweringDAS | 1564 | 0.97 | 0.95 | -2.75 | 123.54 | 11.11 | 0.09 | 0.99 |
| Phenology.HaunStage | 10180 | 0.97 | 0.95 | -0.03 | 0.70 | 0.84 | 0.12 | 0.99 |
| Phenology.HeadingDAS | 5205 | 0.93 | 0.87 | -0.22 | 129.50 | 11.38 | 0.10 | 0.96 |
| Phenology.MaturityDAS | 297 | 0.92 | 0.86 | -1.18 | 550.68 | 23.47 | 0.14 | 0.96 |
| Phenology.Stage | 144 | 0.99 | 0.99 | -0.01 | 0.04 | 0.21 | 0.04 | 1.00 |
| Phenology.TerminalSpikeletDAS | 44 | 0.98 | 0.96 | 17.16 | 466.70 | 21.60 | 0.14 | 0.95 |
| Phenology.Zadok.Stage | 3795 | 0.95 | 0.91 | 1.62 | 62.99 | 7.94 | 0.17 | 0.97 |
| Population | 34 | 0.36 | 0.13 | -1.13 | 473.25 | 21.75 | 0.12 | 0.63 |
| Spike.HeadNumber | 572 | -0.01 | 0.00 | -509.82 | 1026928.39 | 1013.37 | 2.06 | 0.08 |
| Spike.Live.StorageWt | 11 | 0.19 | 0.04 | -26.33 | 947.03 | 30.77 | 1.11 | 0.09 |
| Spike.N | 71 | 0.45 | 0.20 | -0.74 | 3.80 | 1.95 | 0.96 | 0.59 |
| Spike.NConc | 18 | 0.63 | 0.40 | 0.00 | 0.00 | 0.01 | 0.40 | 0.73 |
| Spike.Wt | 620 | 0.80 | 0.64 | 53.46 | 5842.67 | 76.44 | 0.39 | 0.78 |
| Stem.Live.StorageWt | 11 | 0.39 | 0.15 | -126.12 | 17791.85 | 133.39 | 0.87 | 0.32 |
| Stem.N | 467 | 0.72 | 0.52 | 2.15 | 12.08 | 3.48 | 0.69 | 0.74 |
| Stem.NConc | 438 | 0.88 | 0.77 | 0.00 | 0.00 | 0.01 | 0.47 | 0.93 |
| Stem.Wt | 1647 | 0.85 | 0.72 | 65.86 | 43400.64 | 208.33 | 0.43 | 0.91 |
| Stem.WtProportion | 365 | 0.84 | 0.71 | 0.09 | 0.02 | 0.13 | 0.30 | 0.82 |
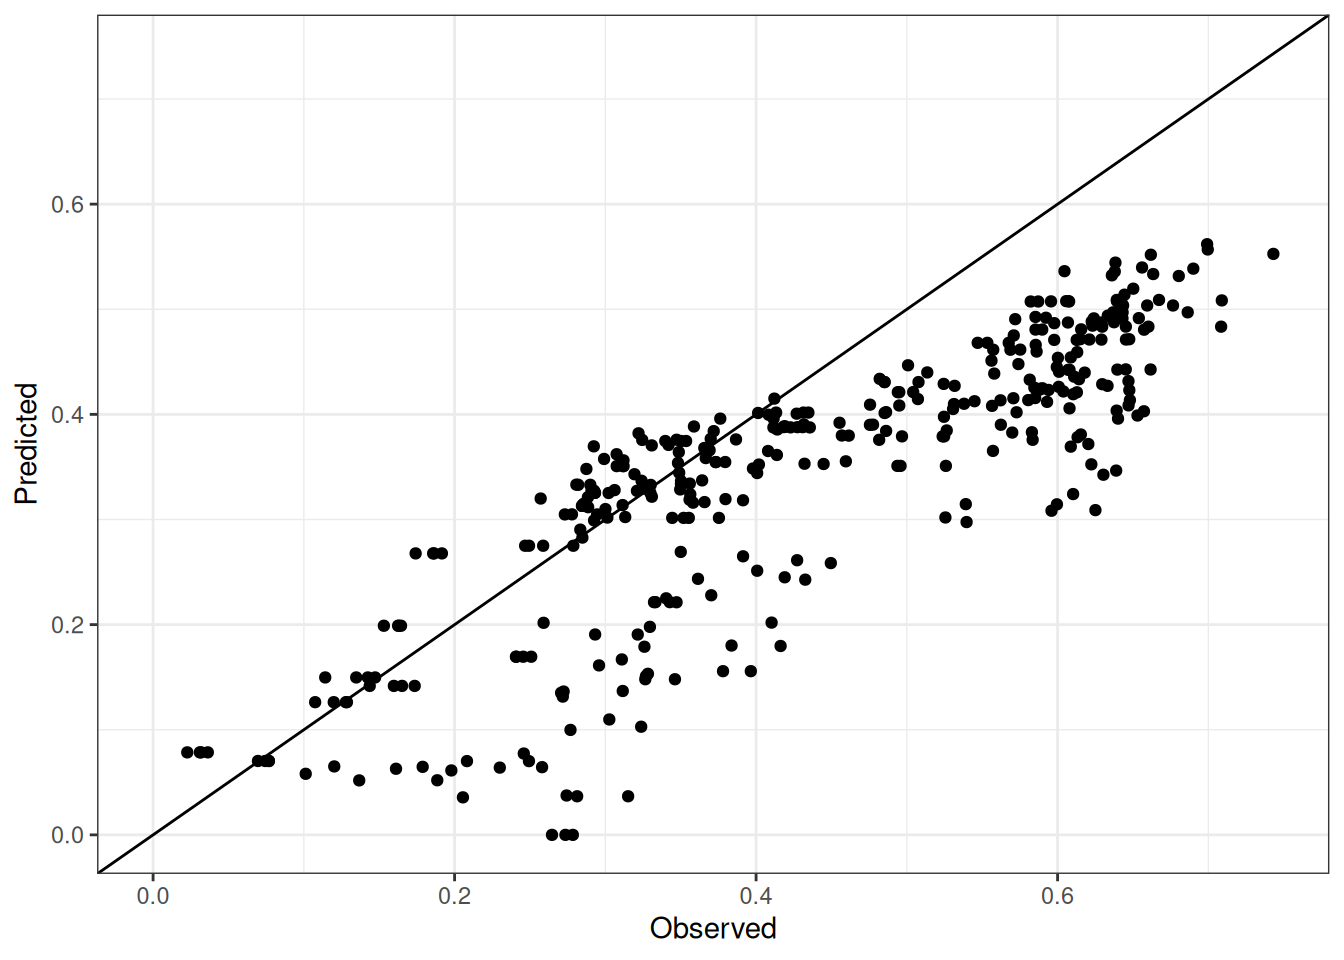
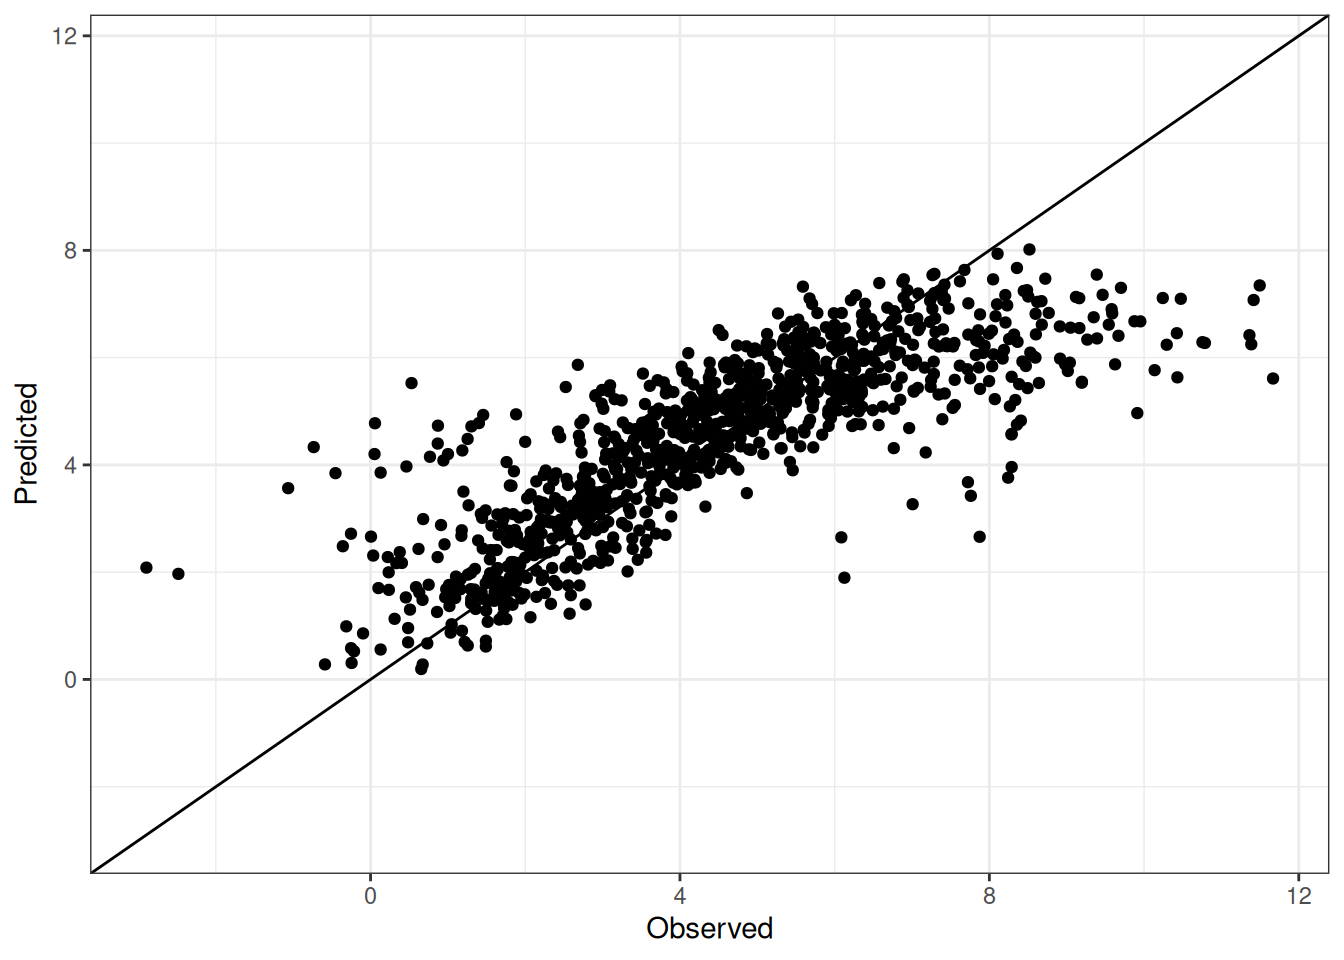
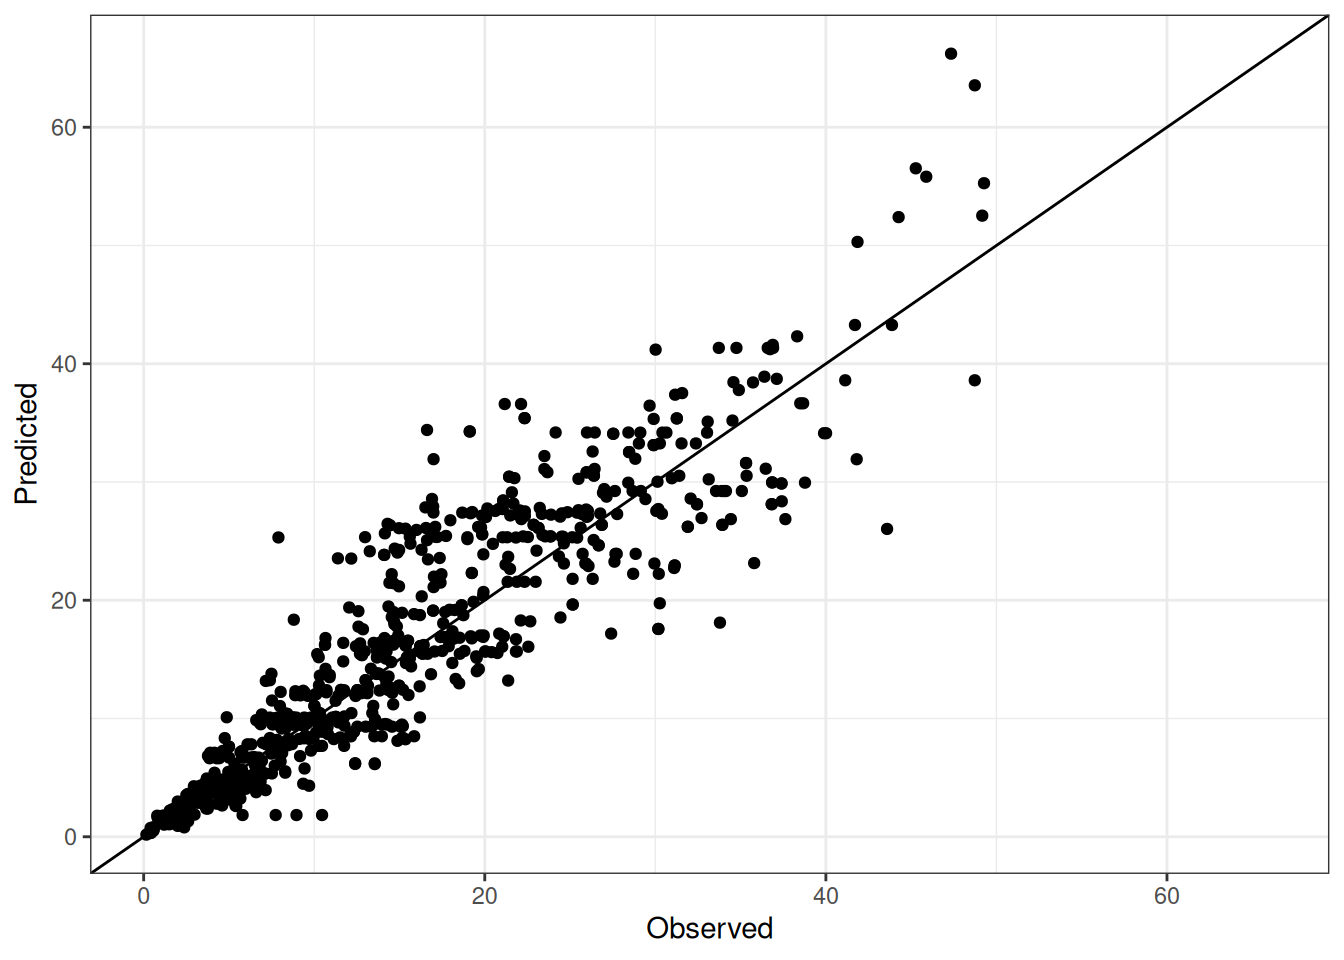
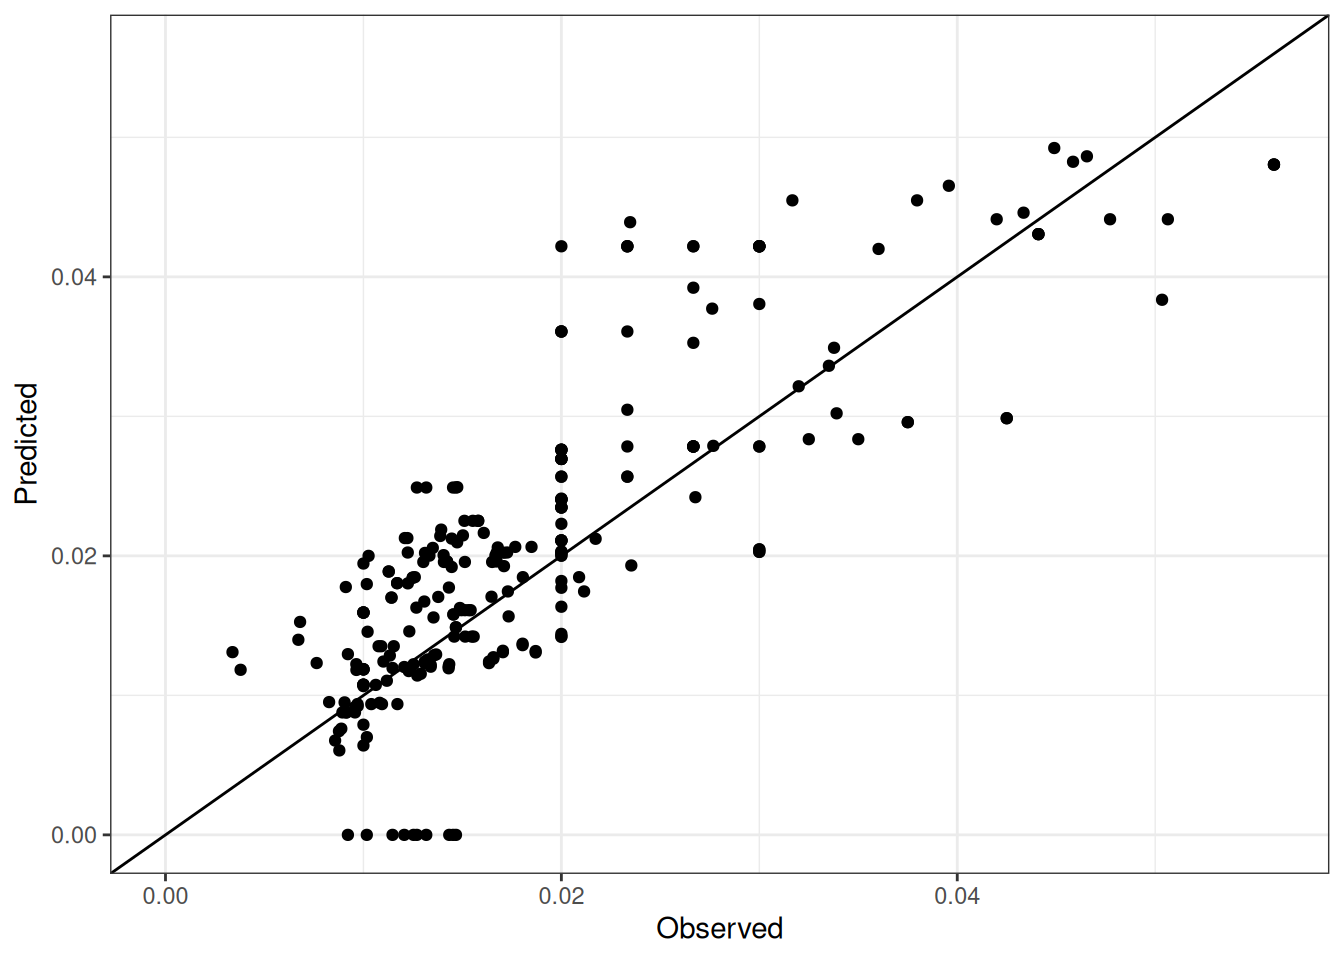
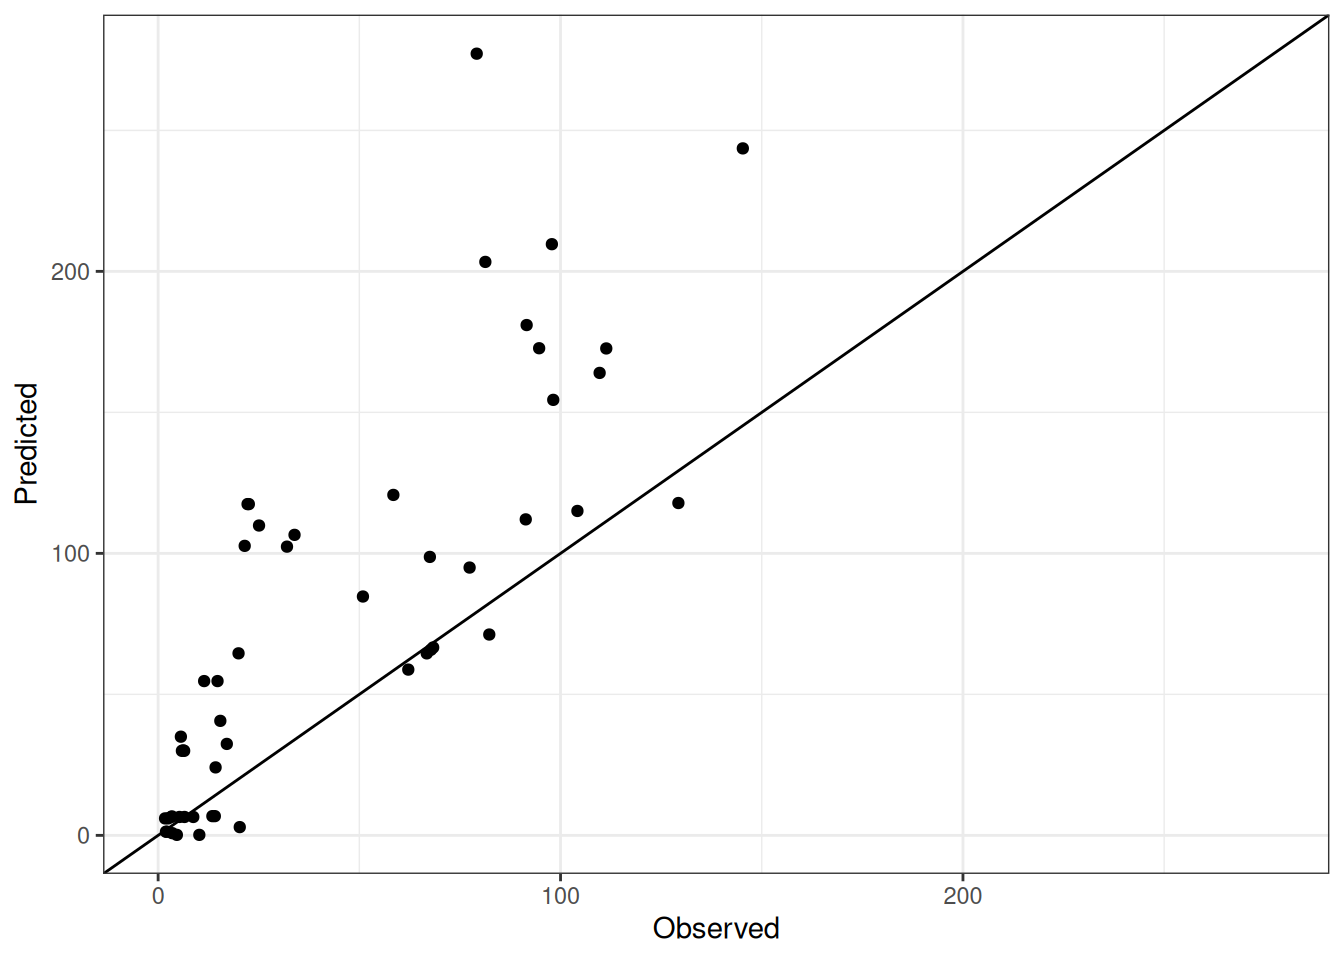
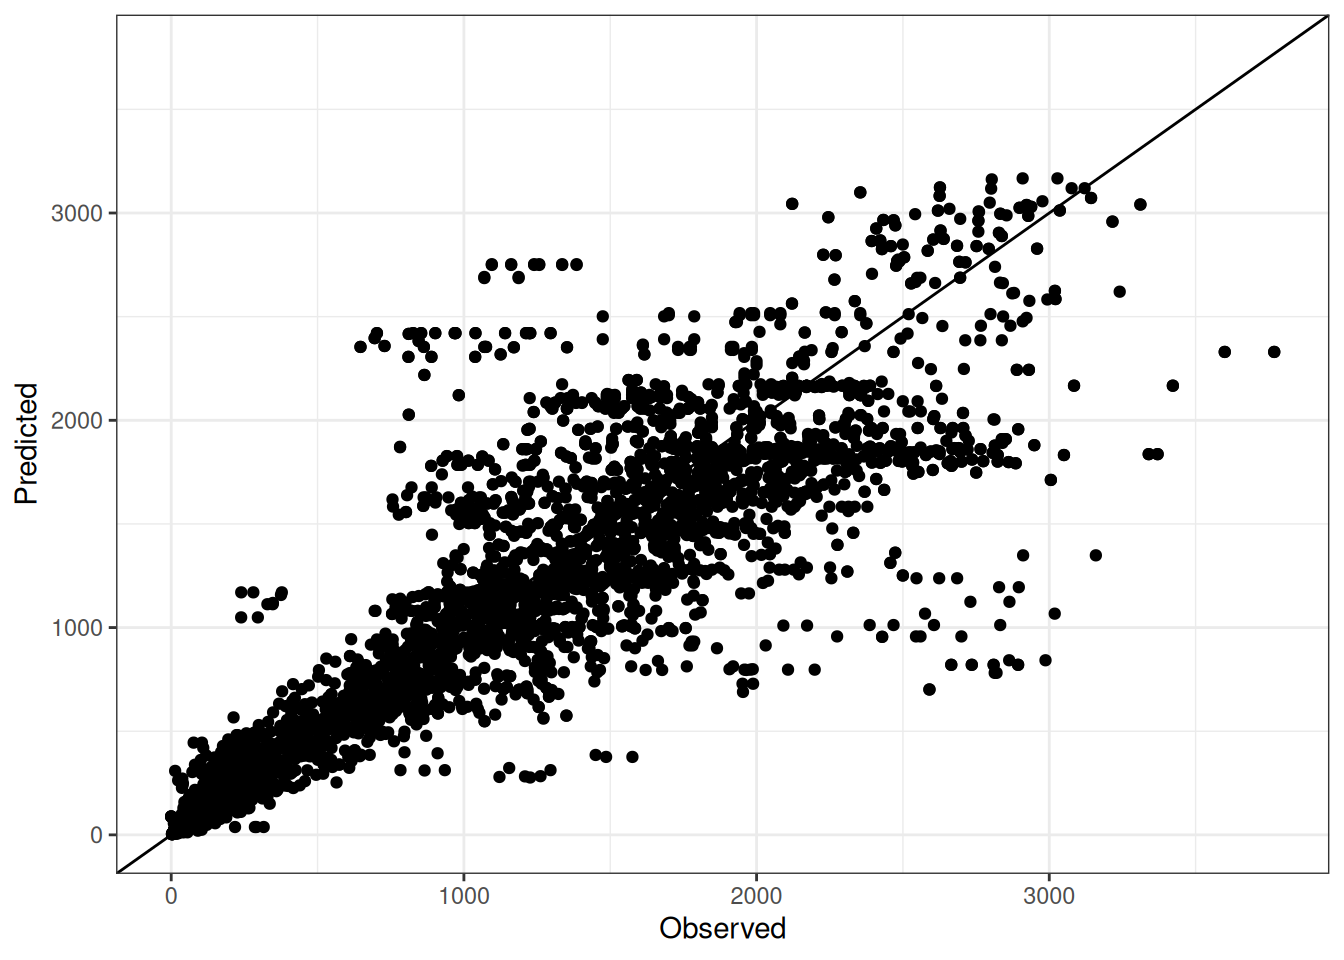
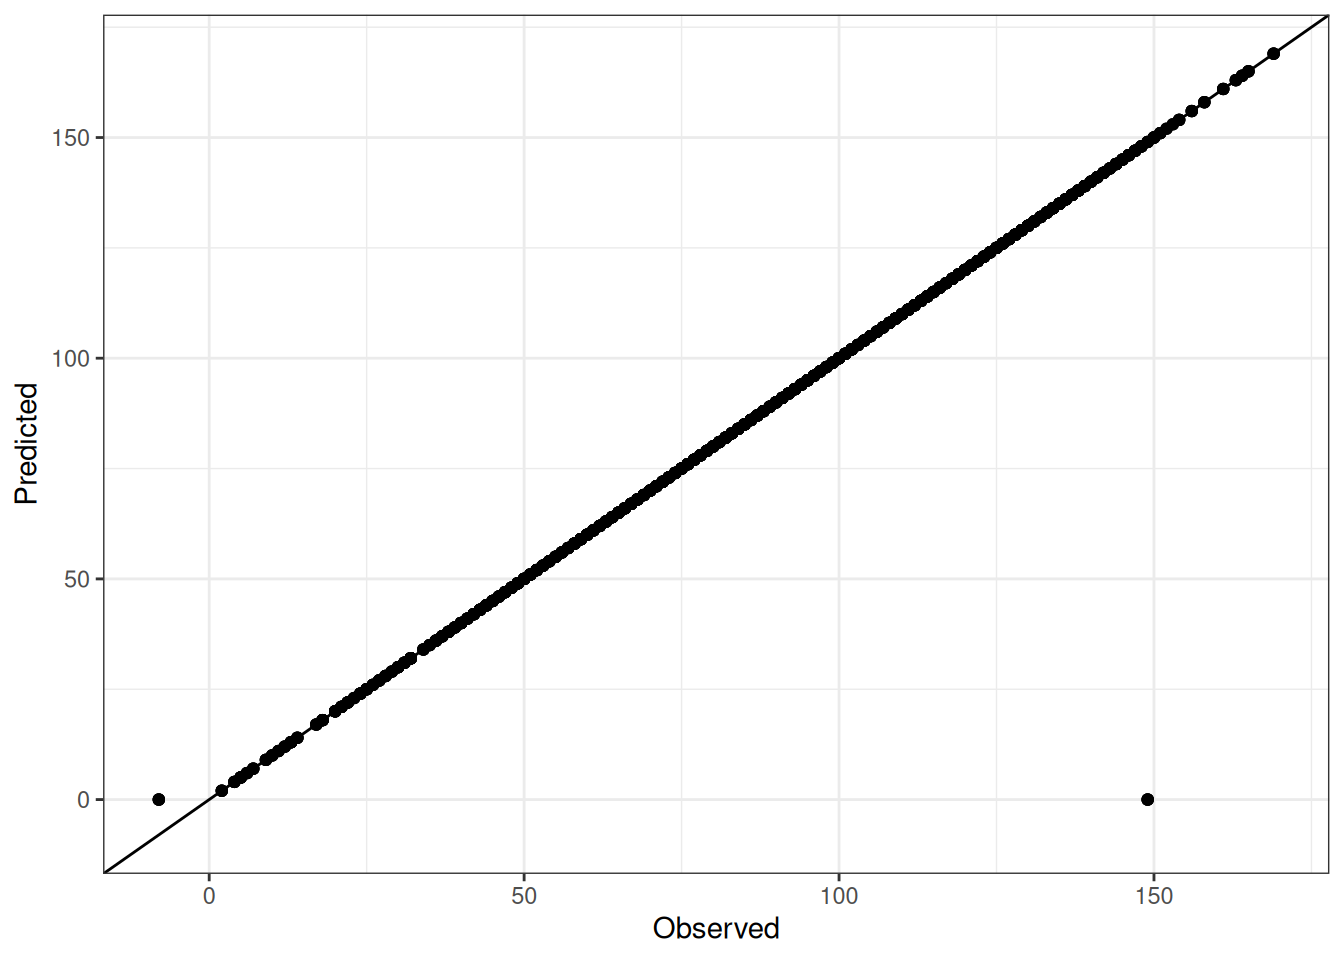
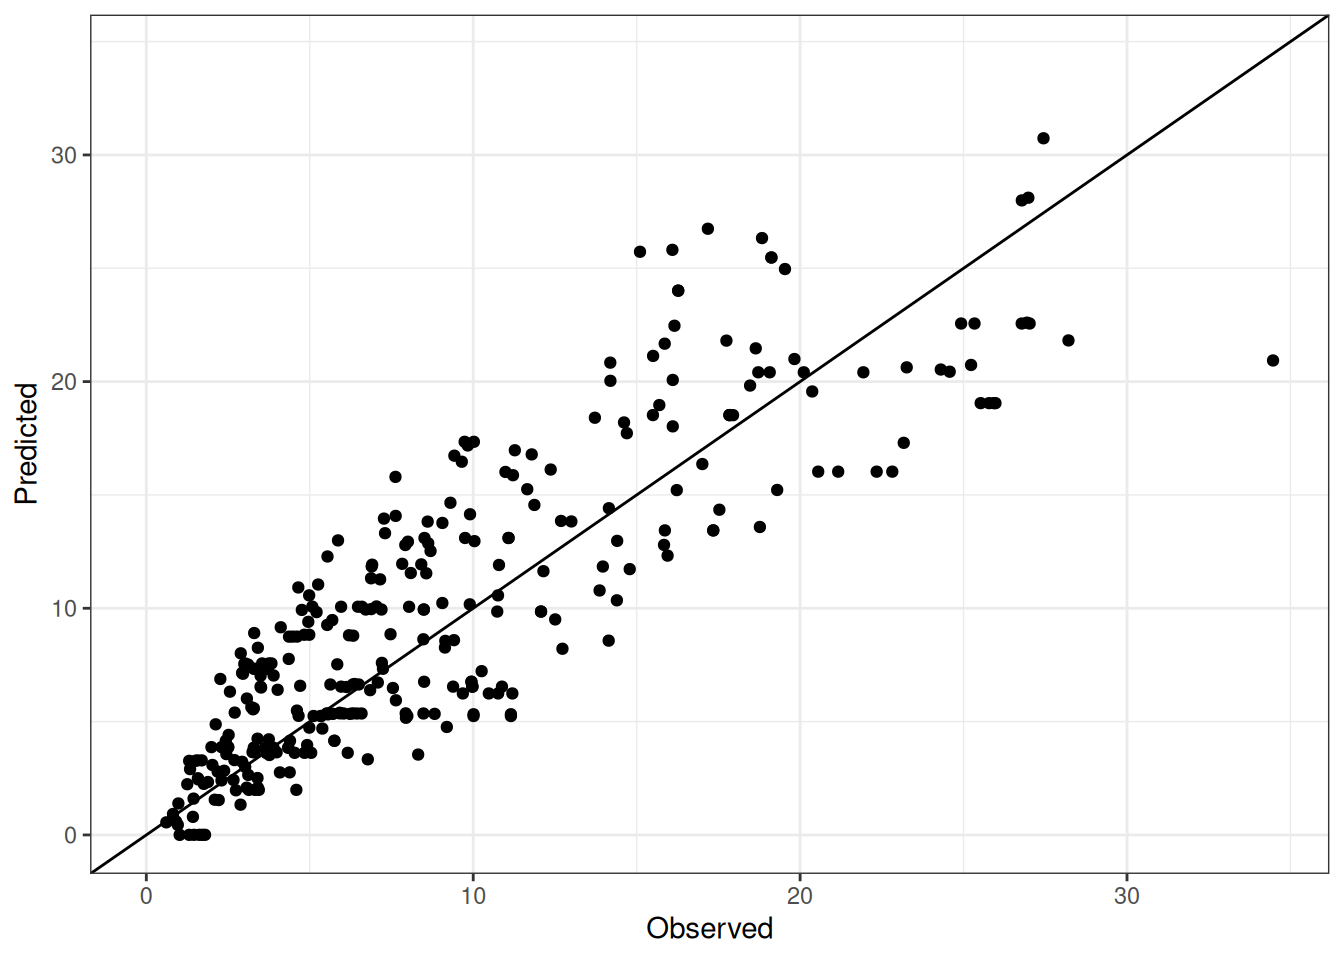
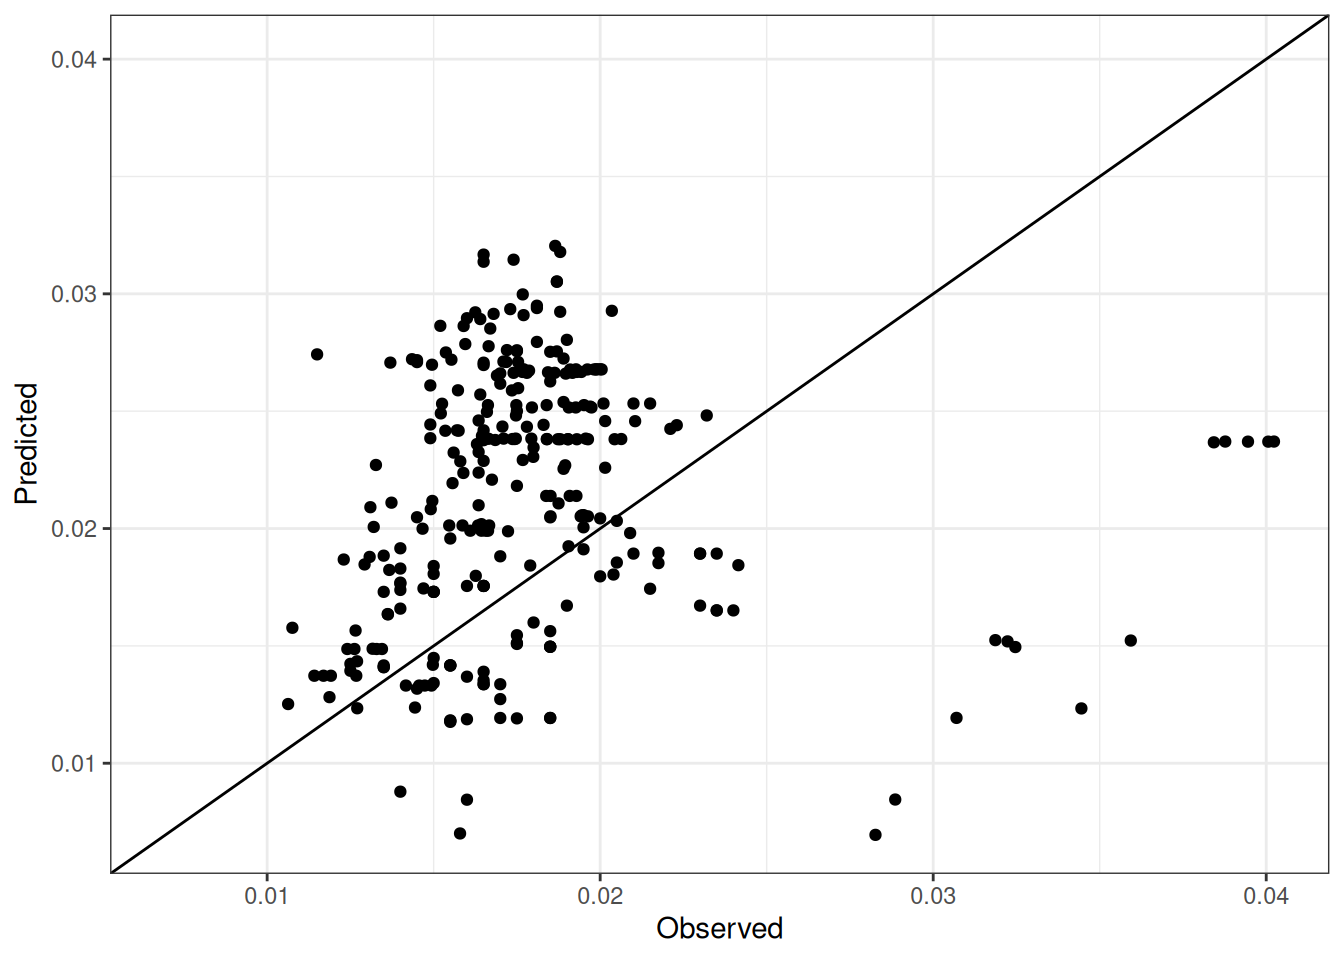
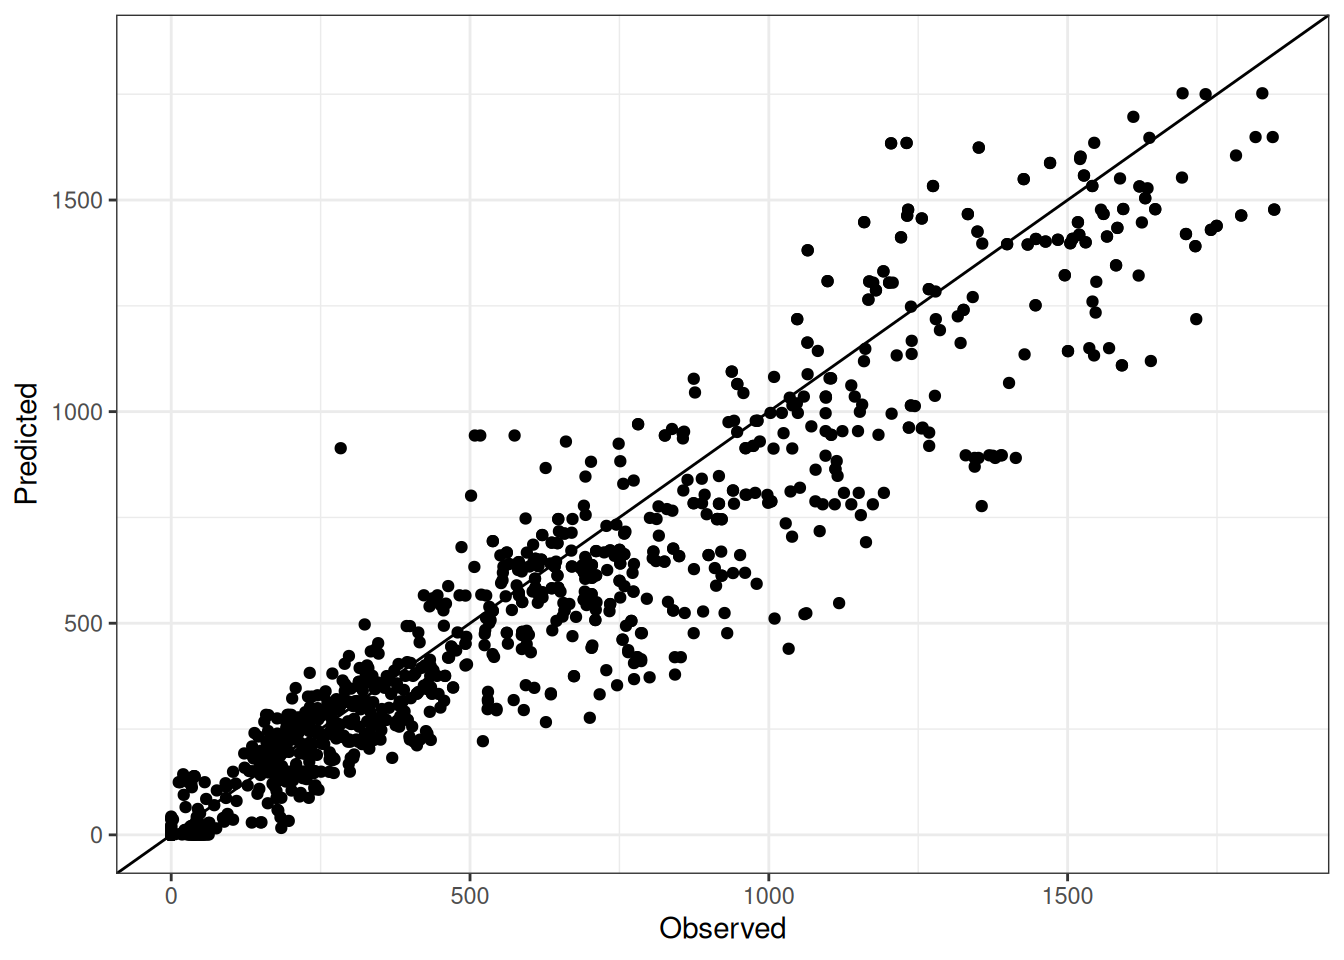
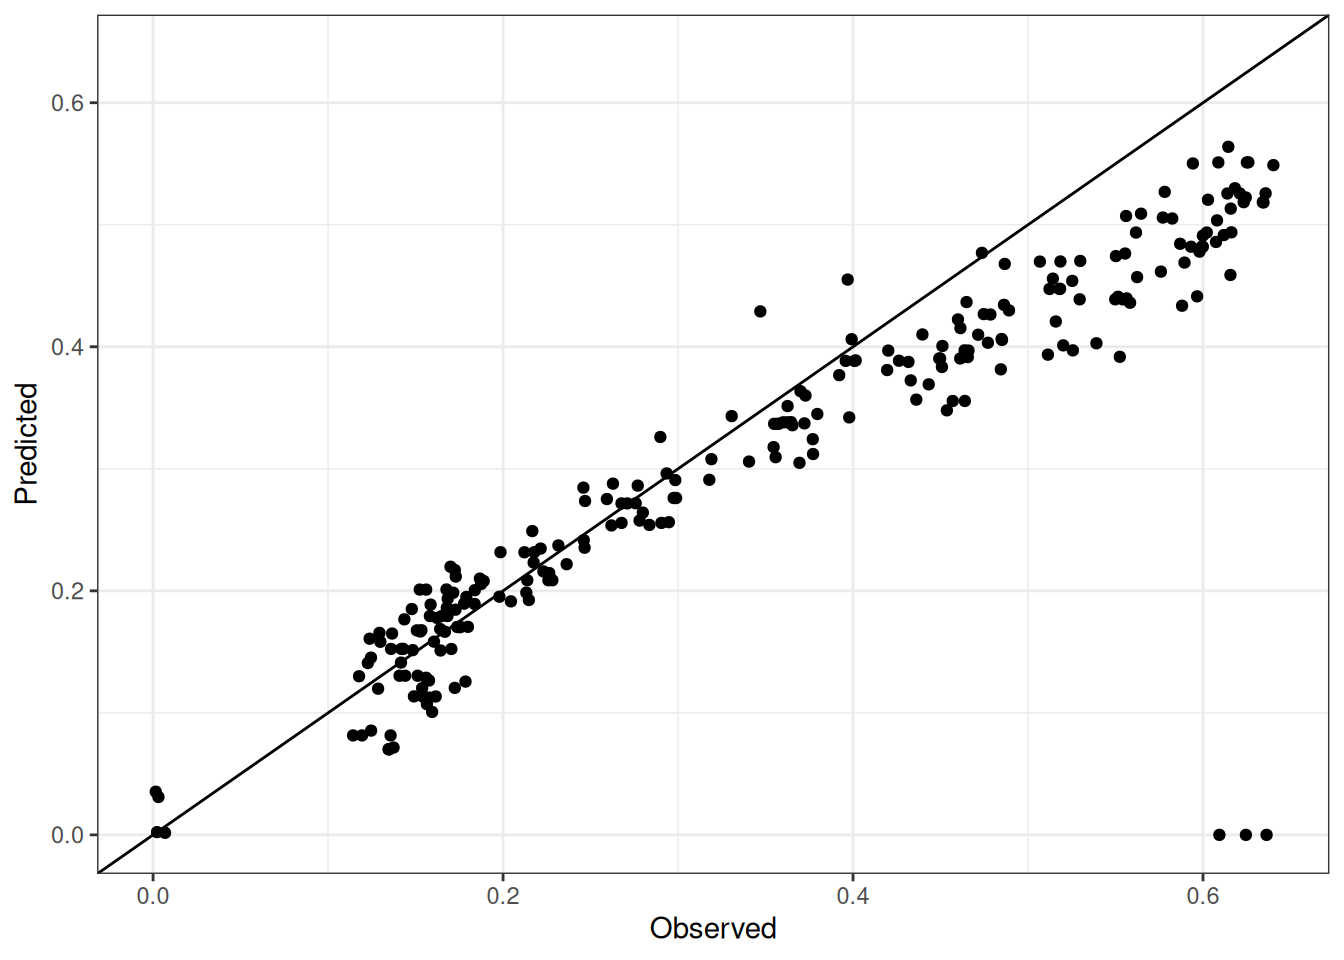
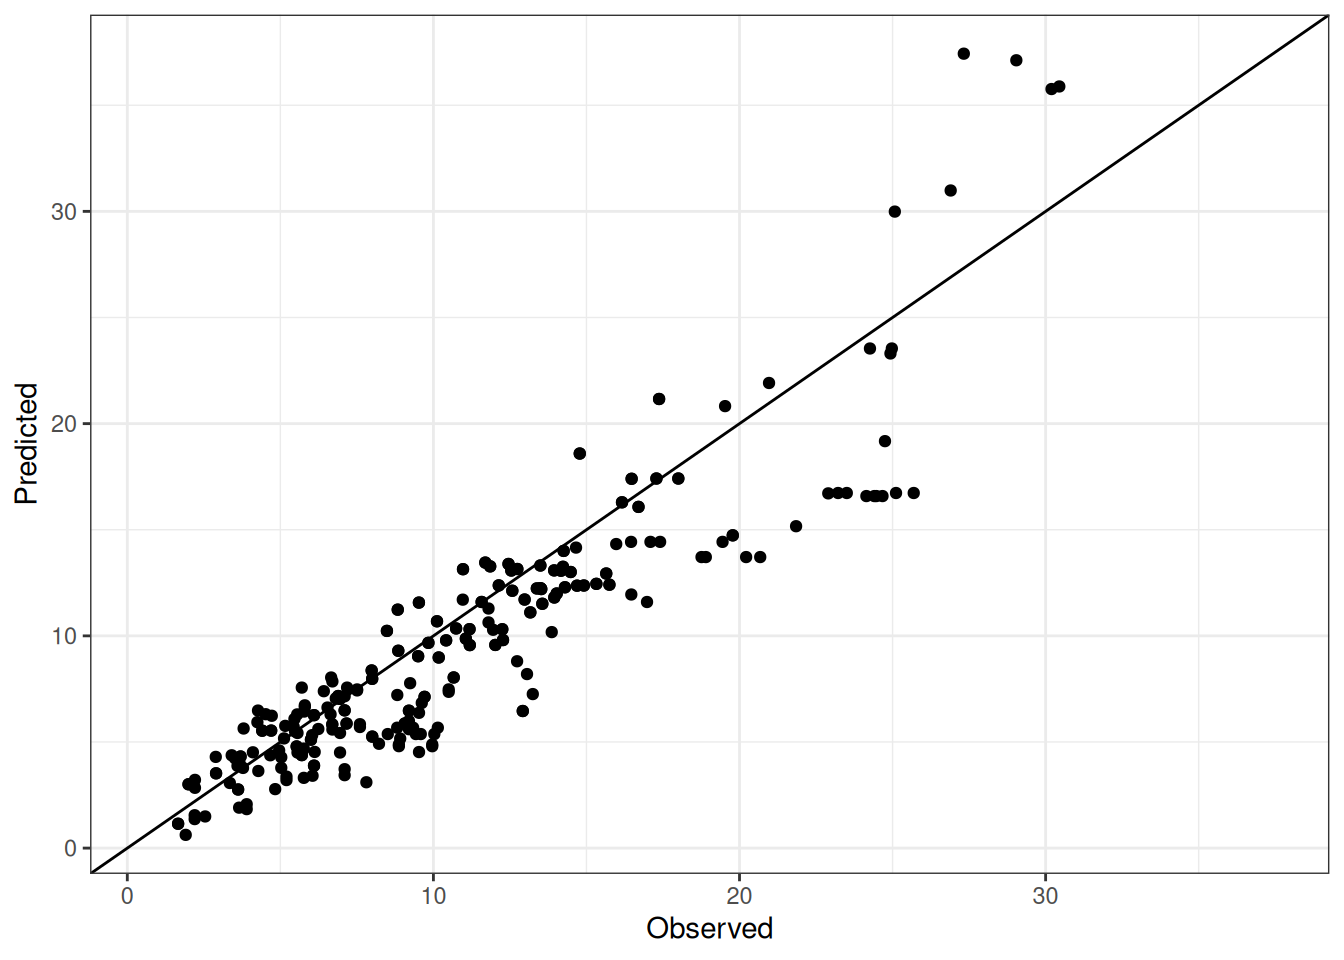
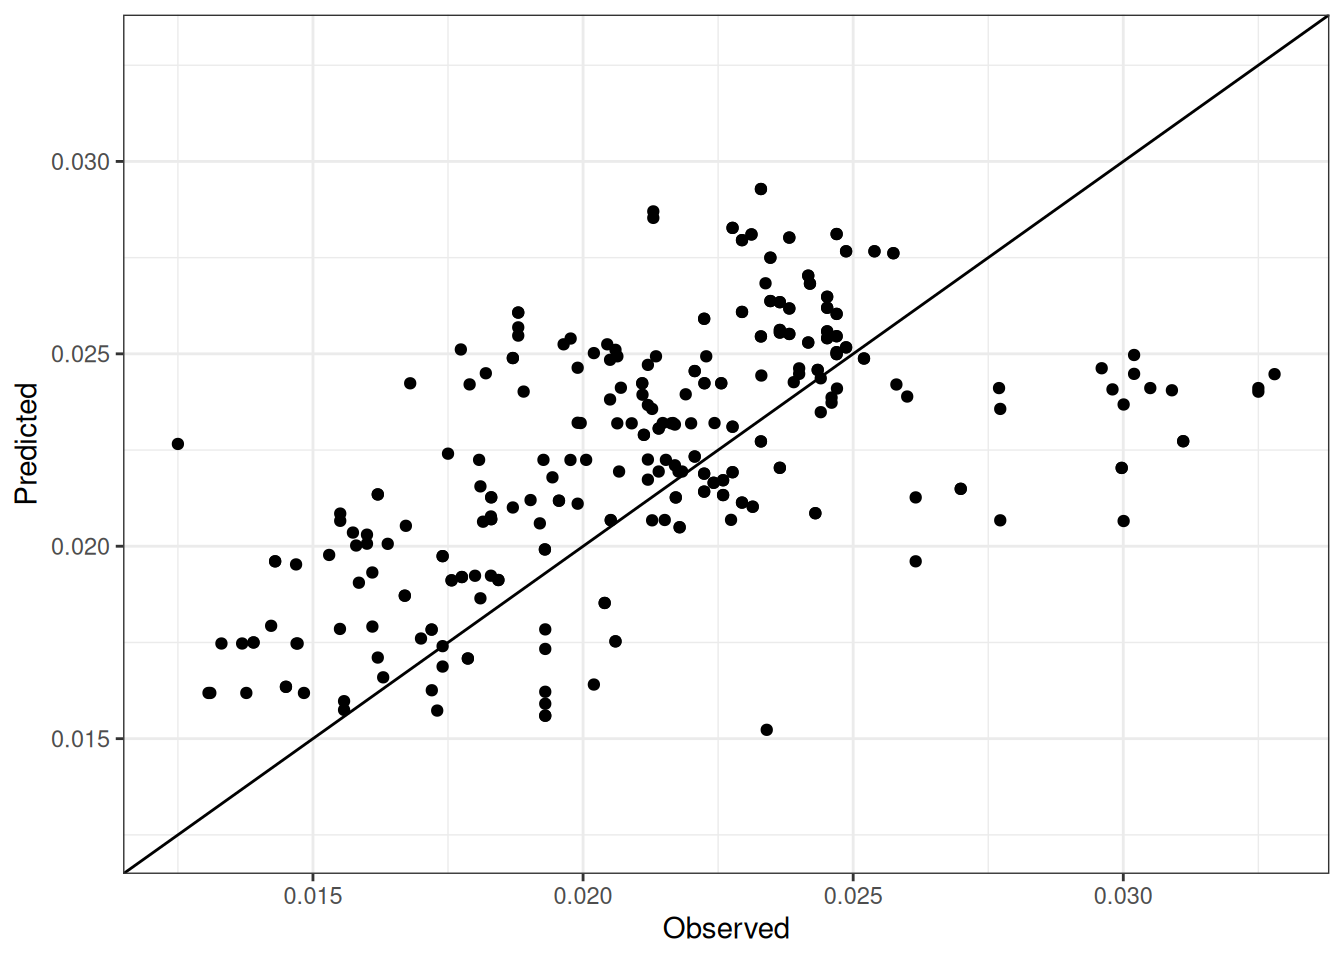
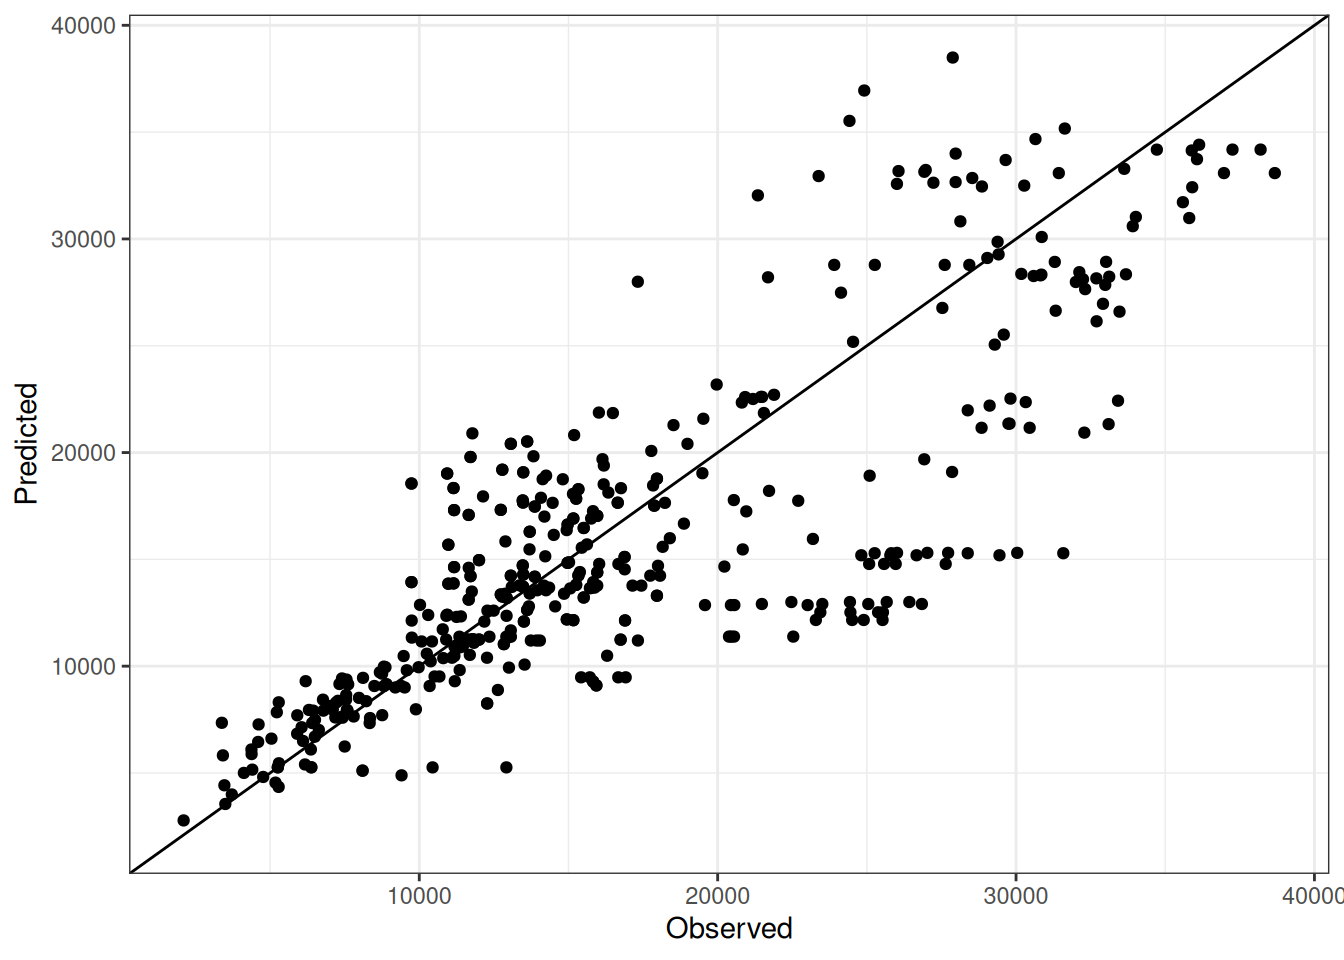
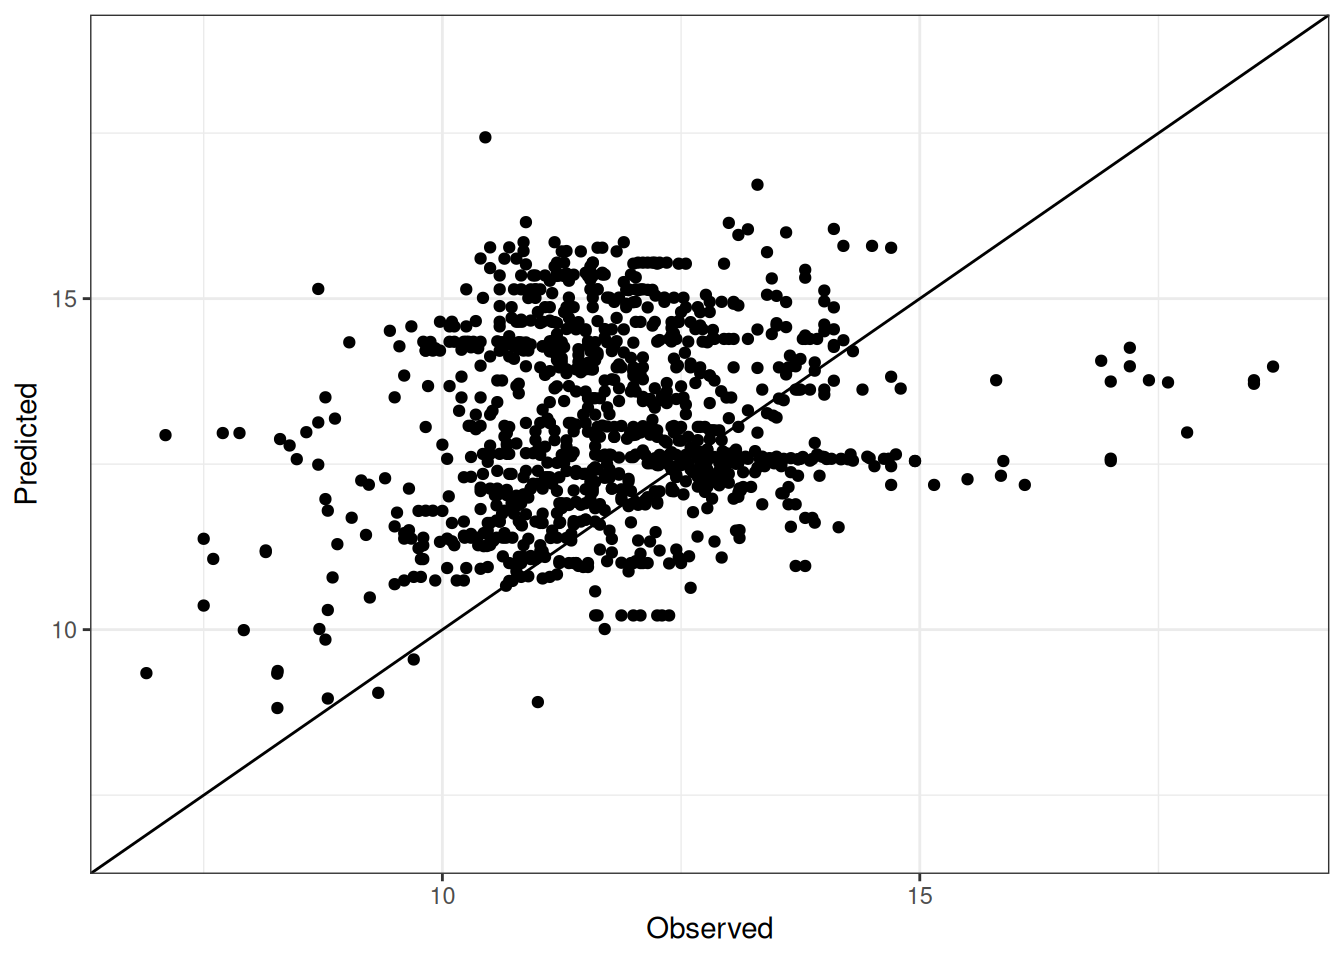
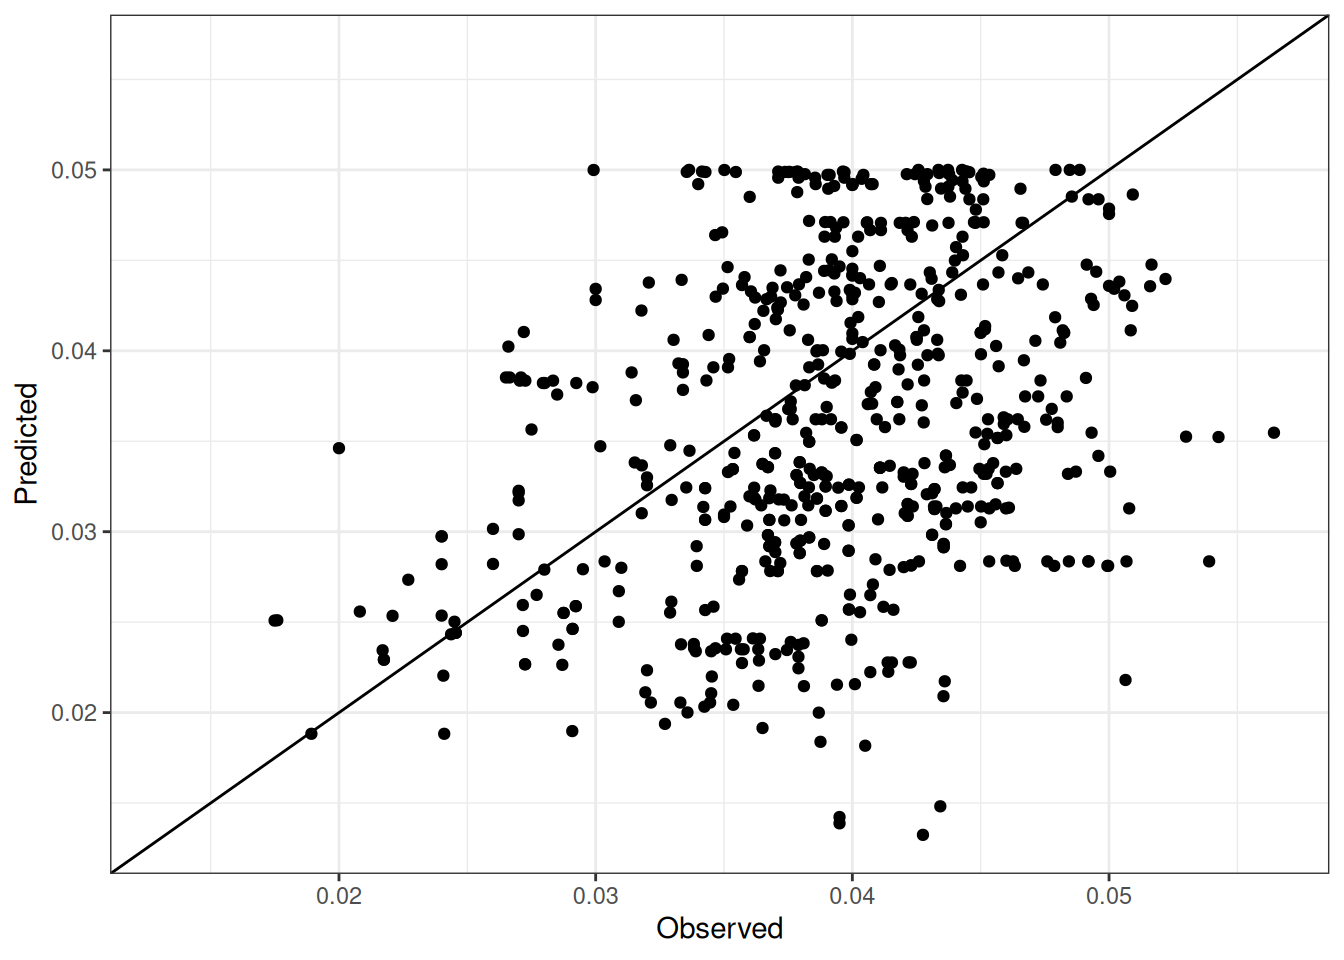
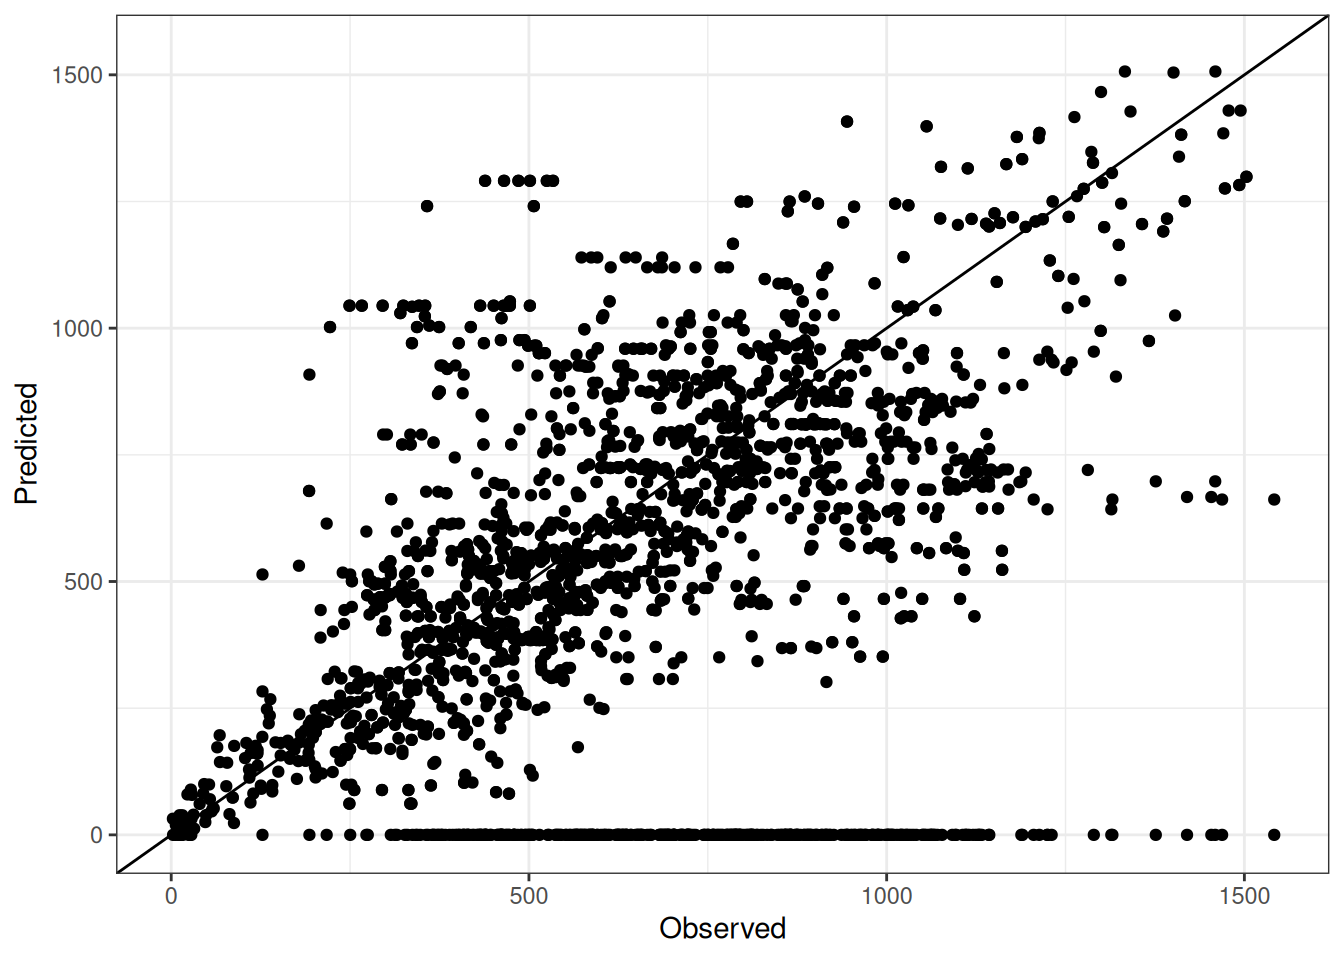
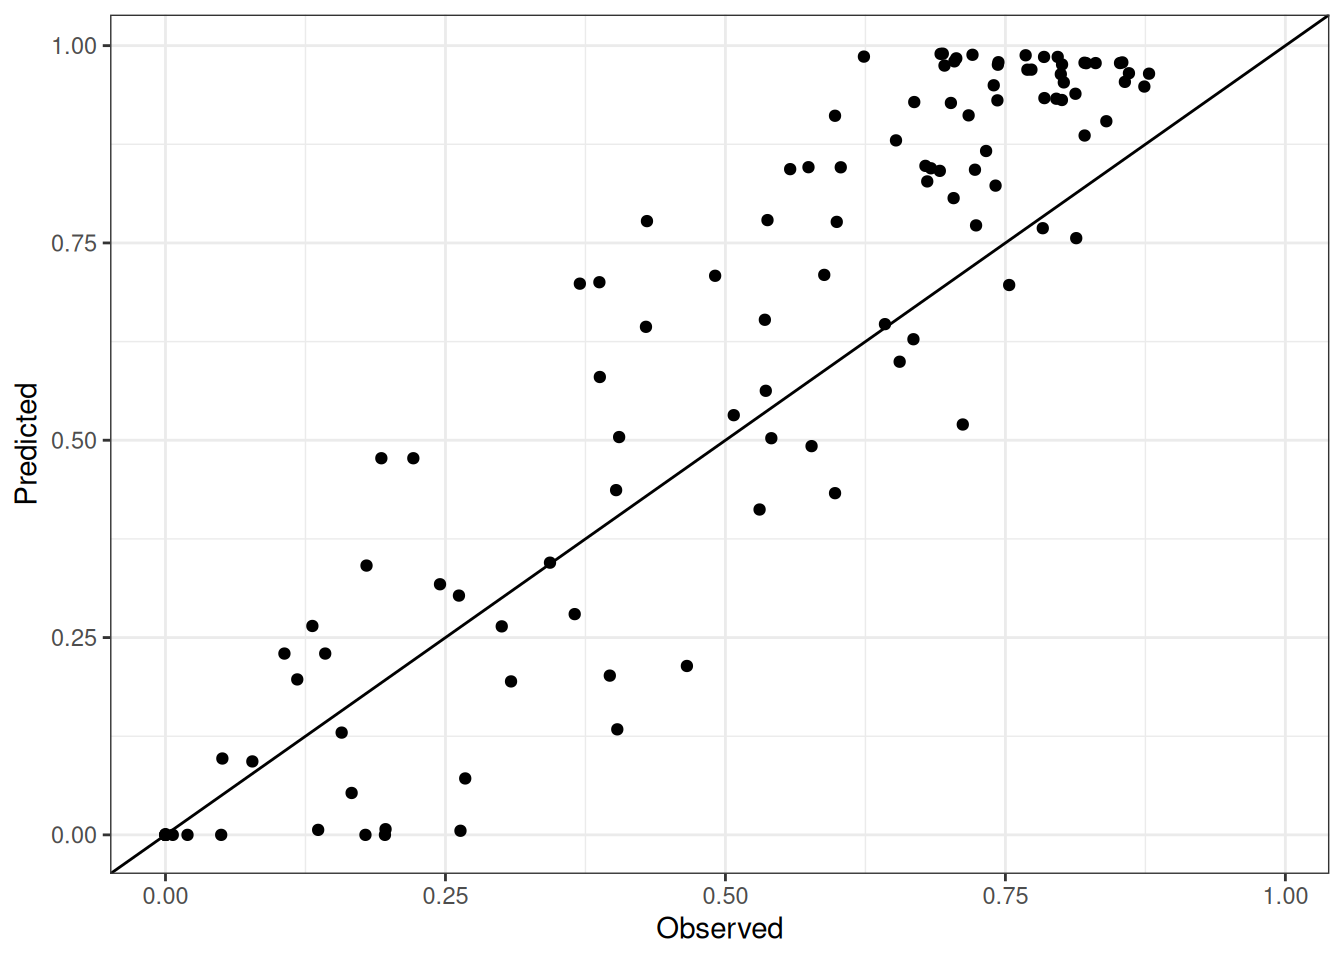
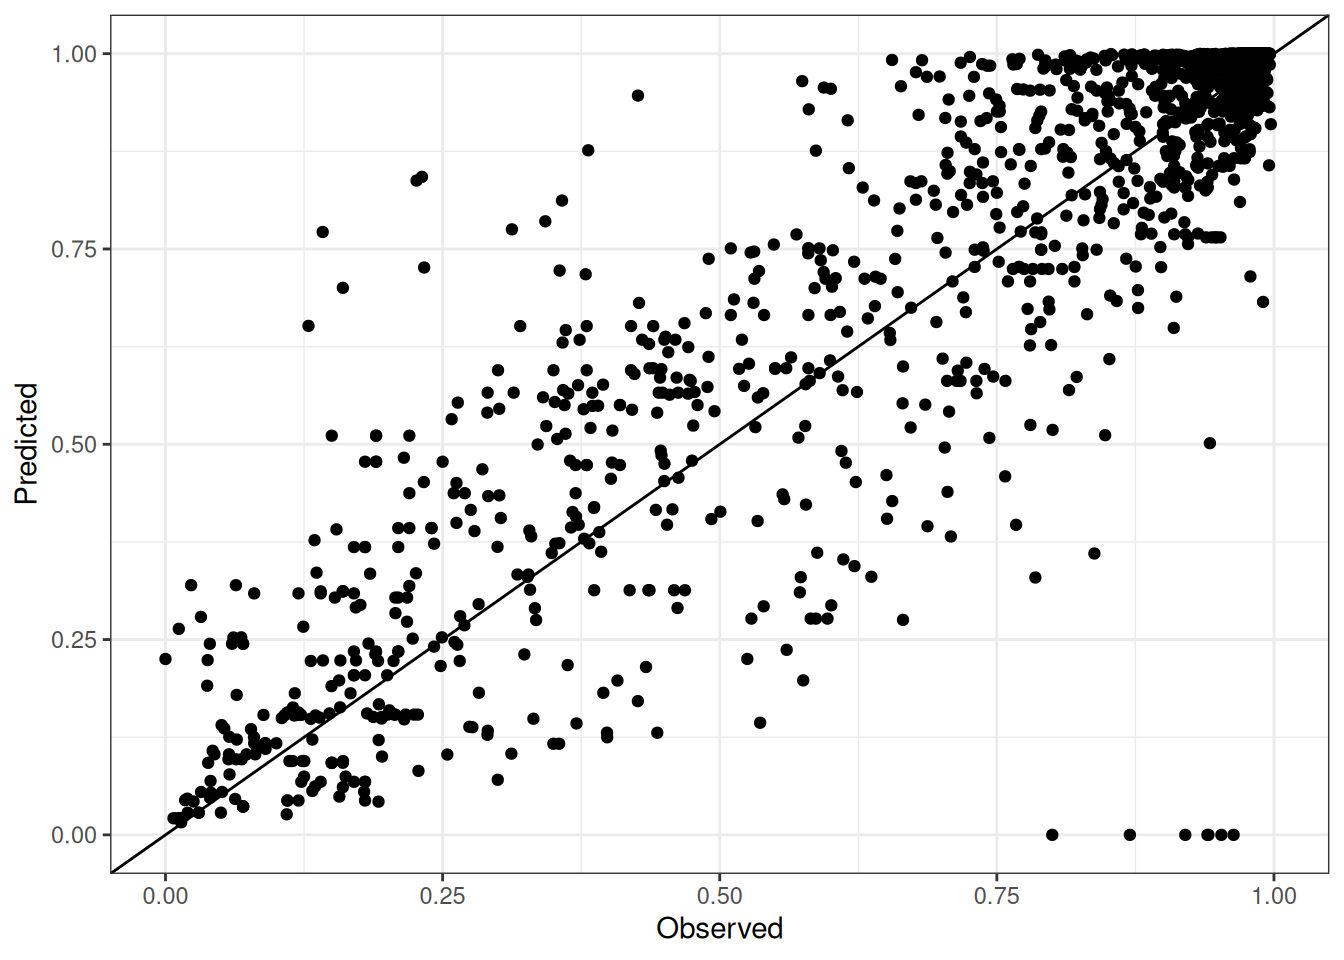
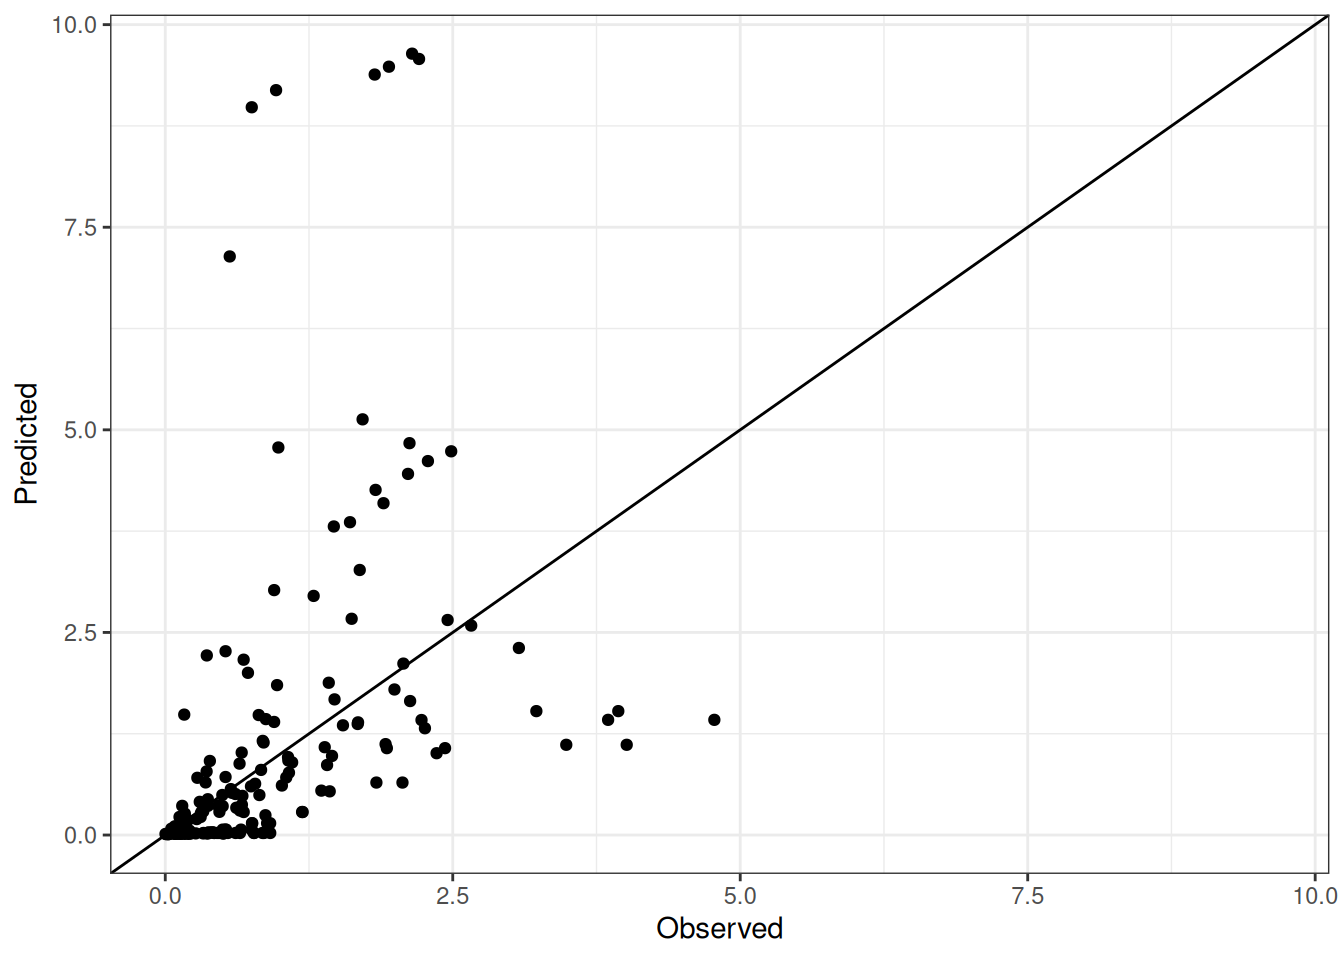
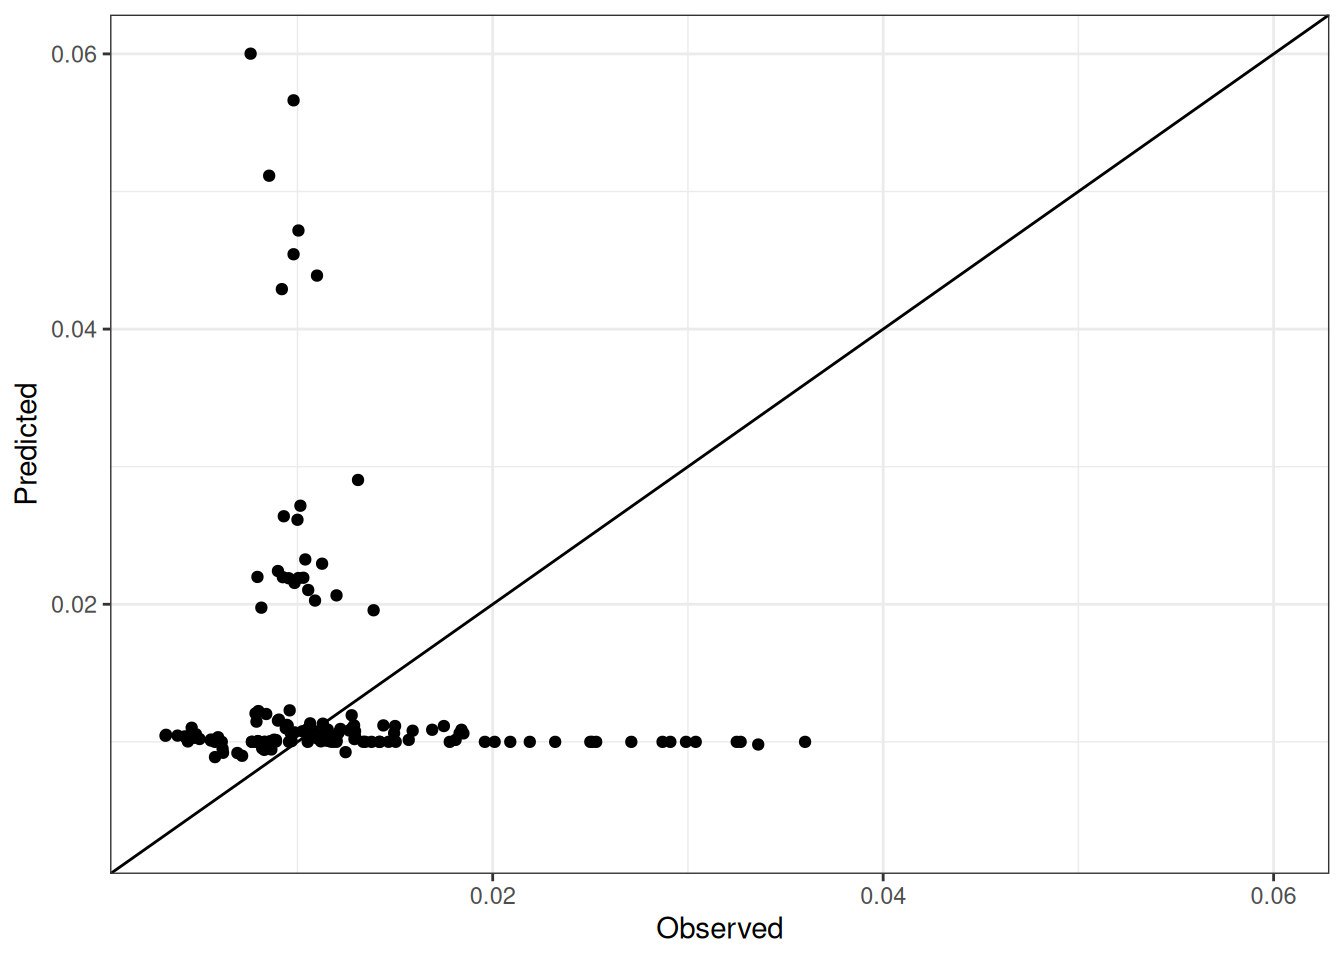
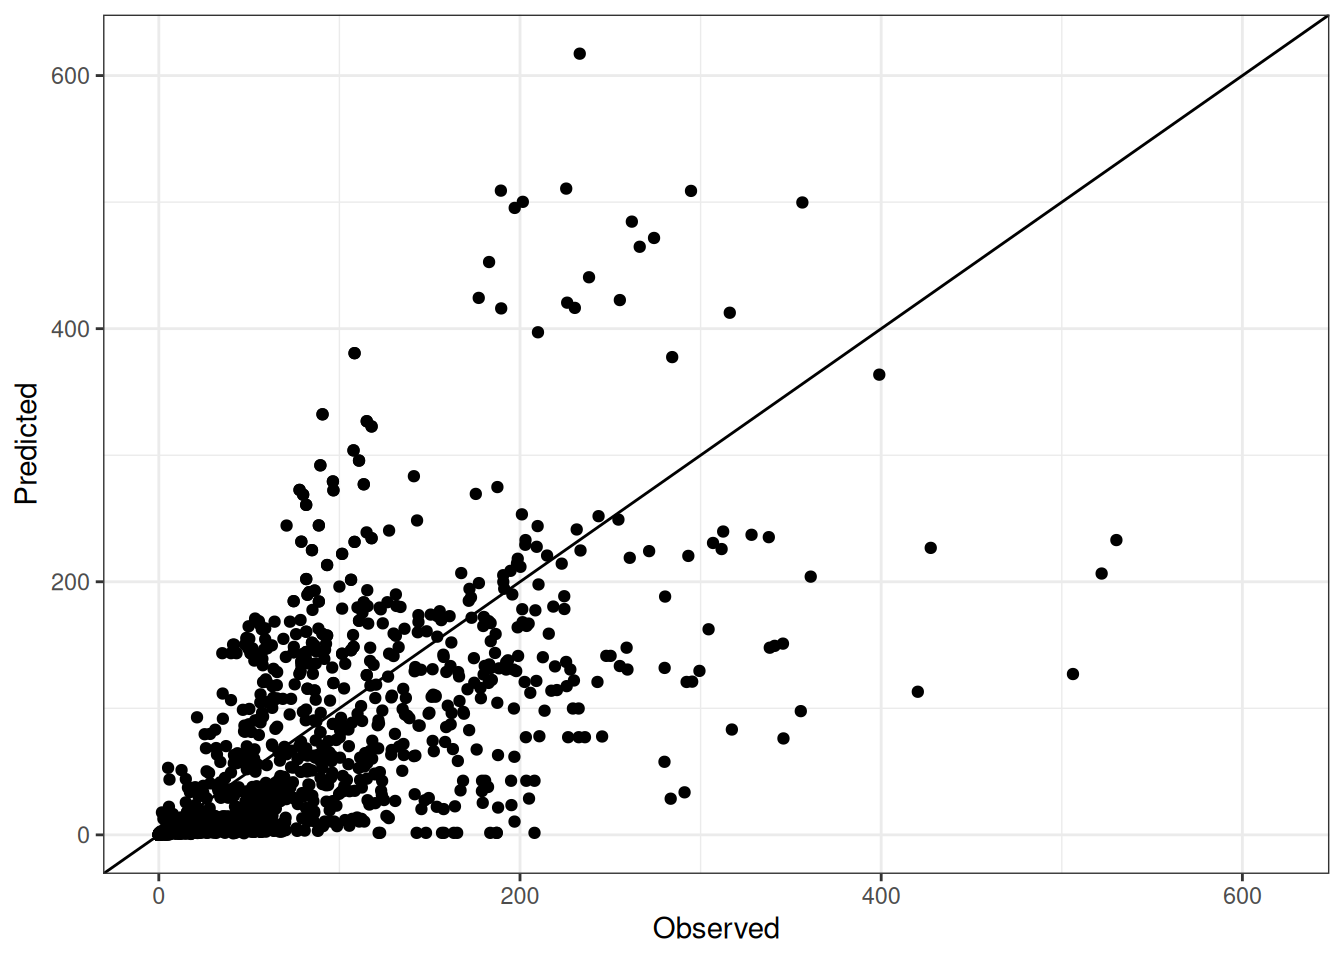
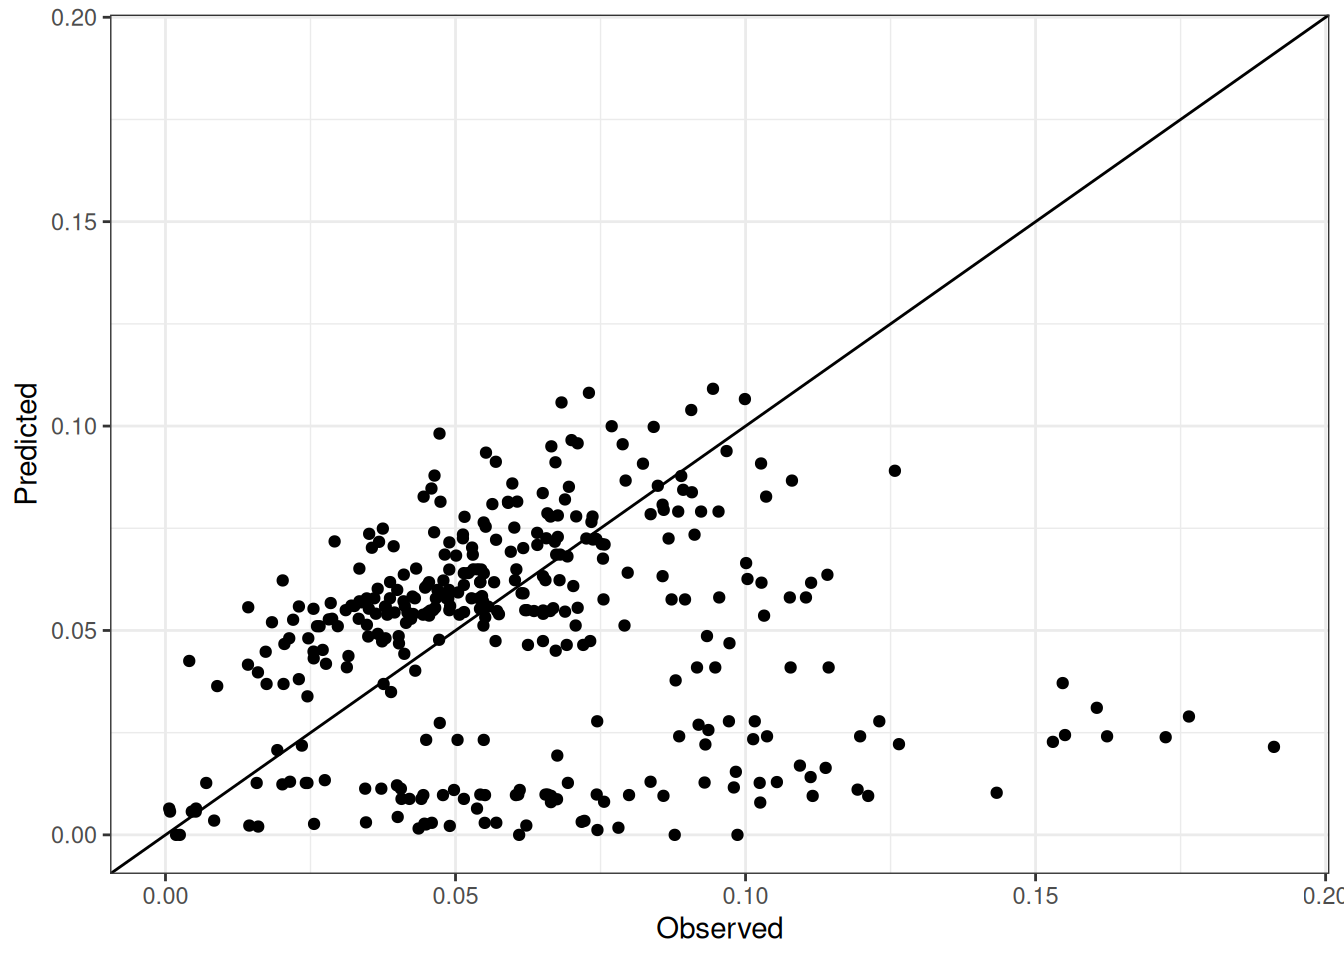
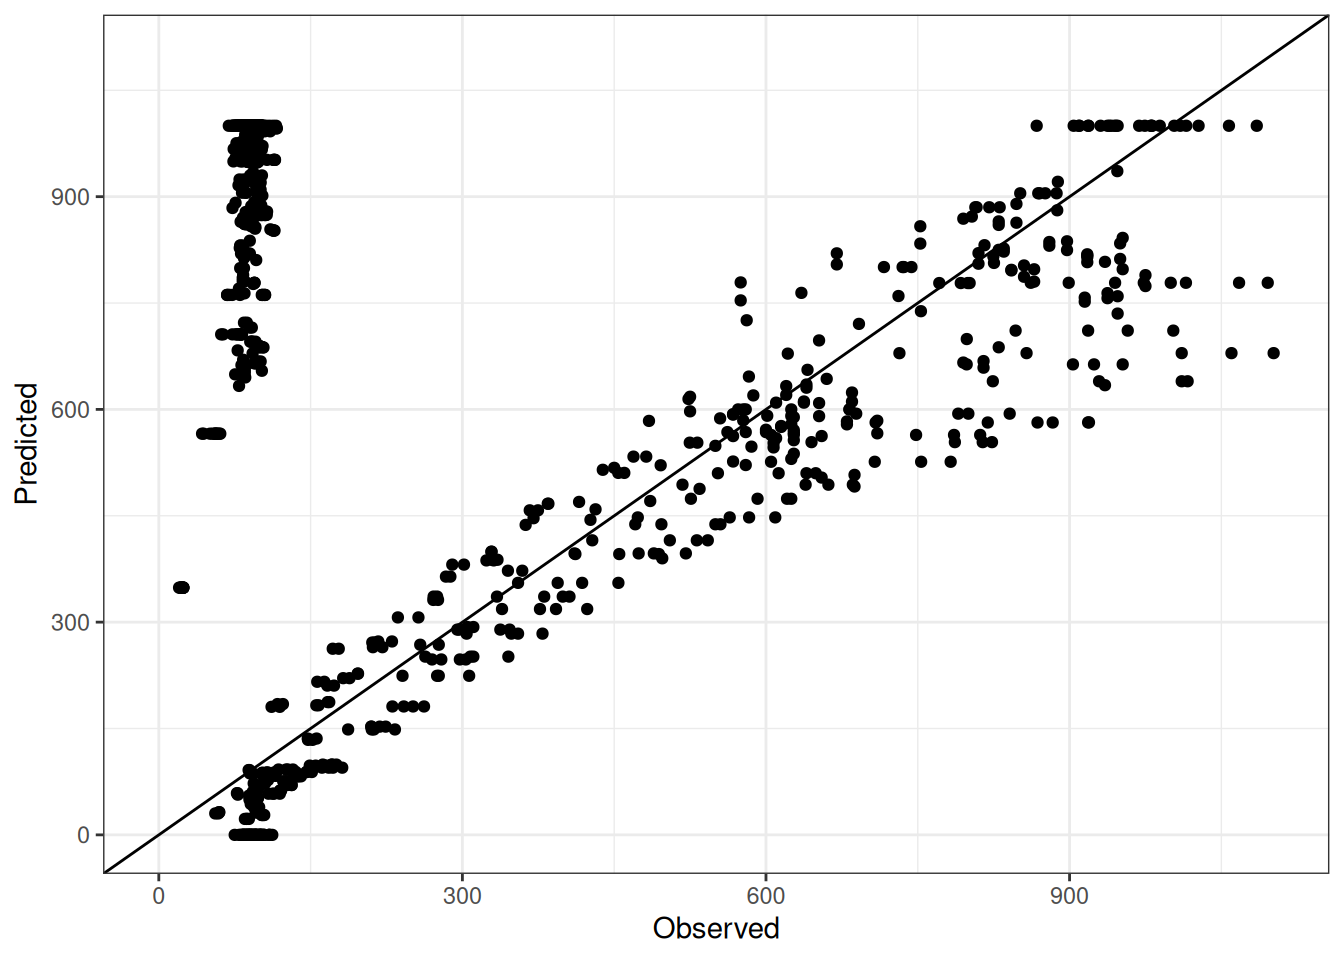
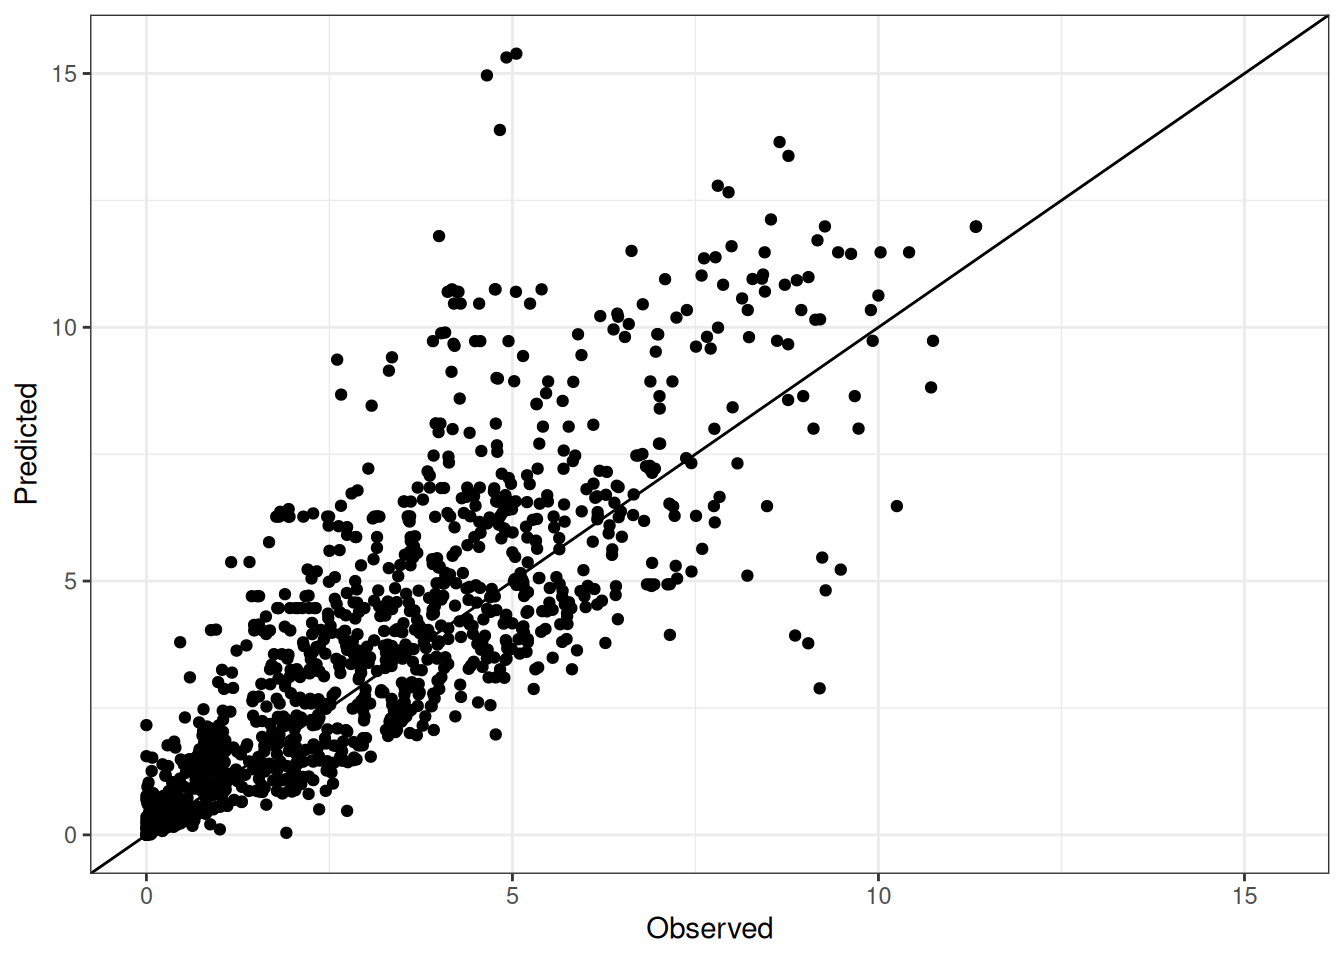
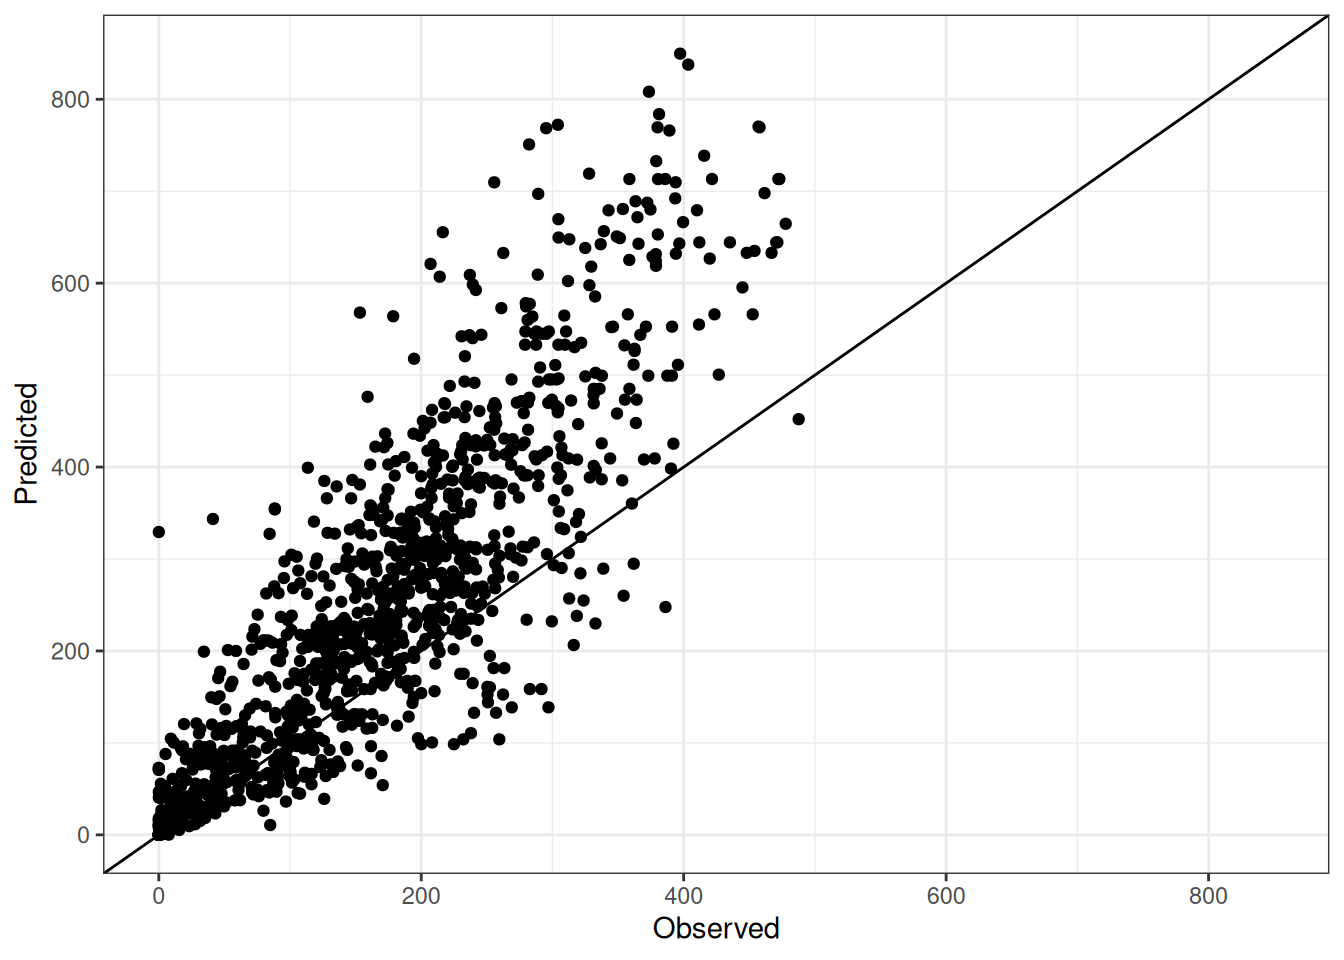
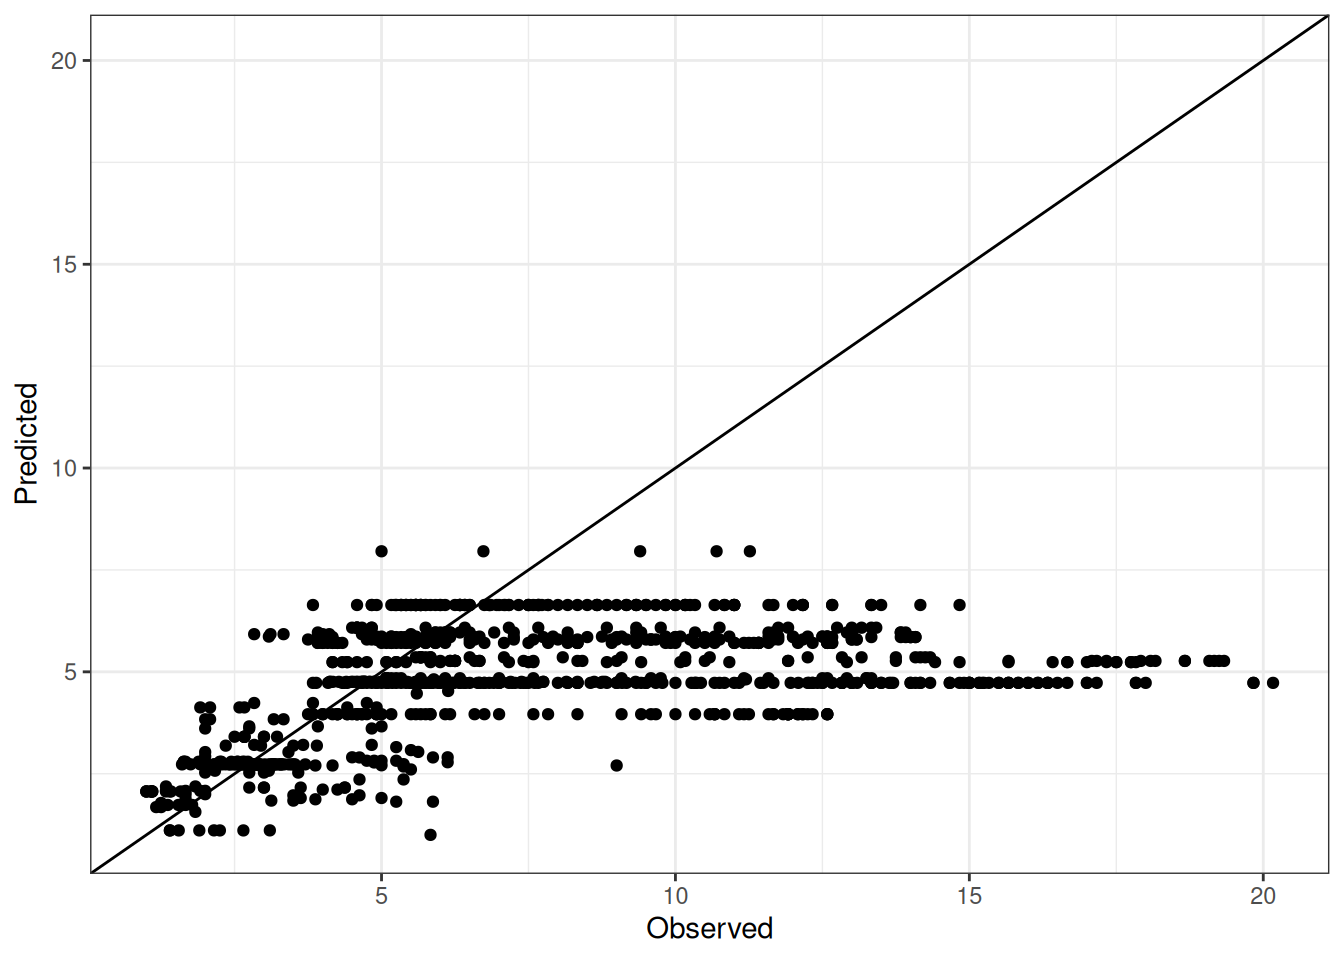
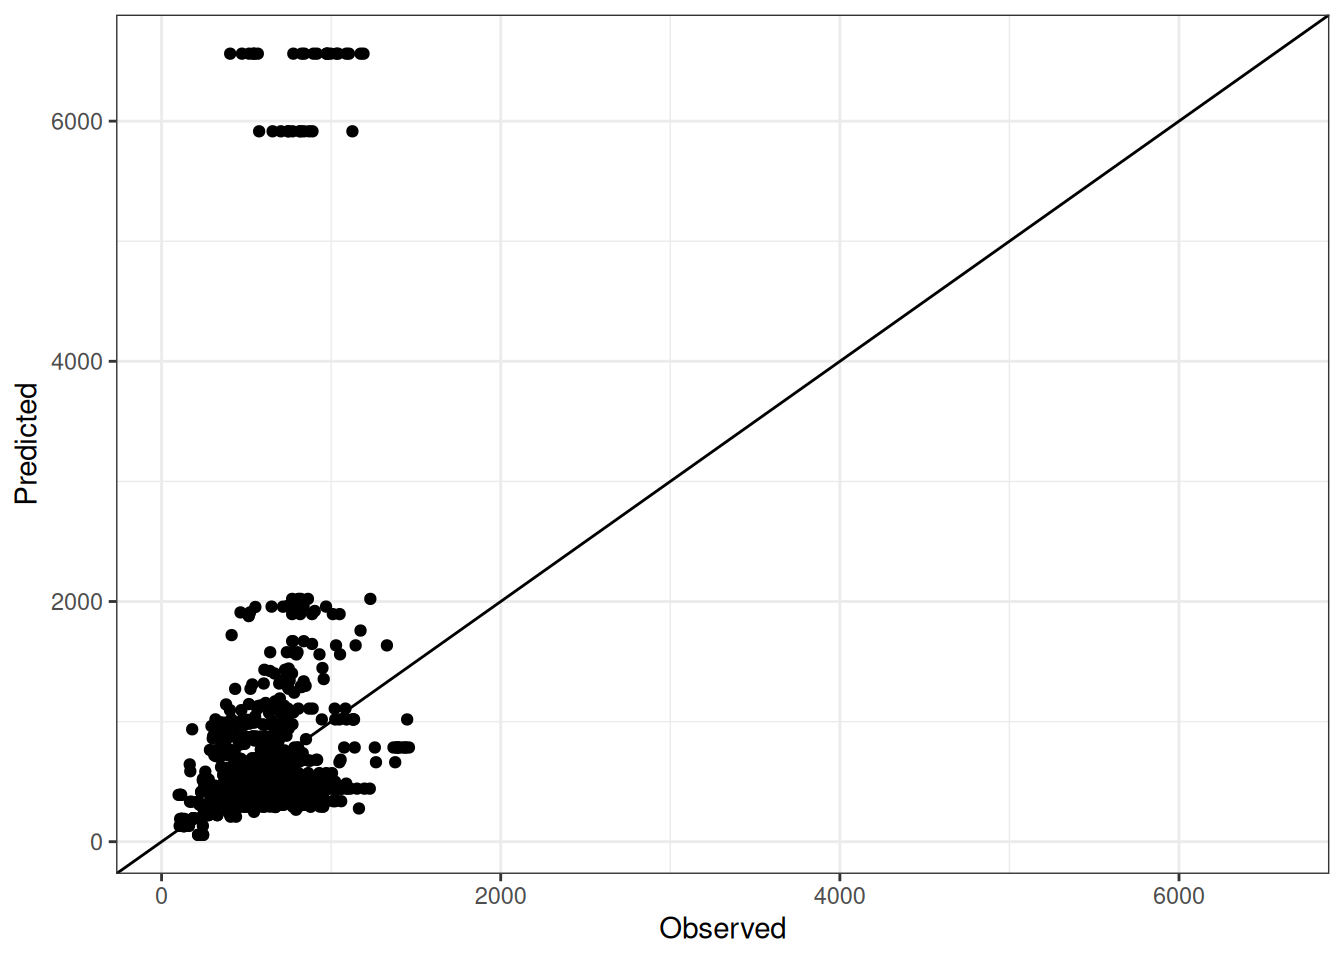
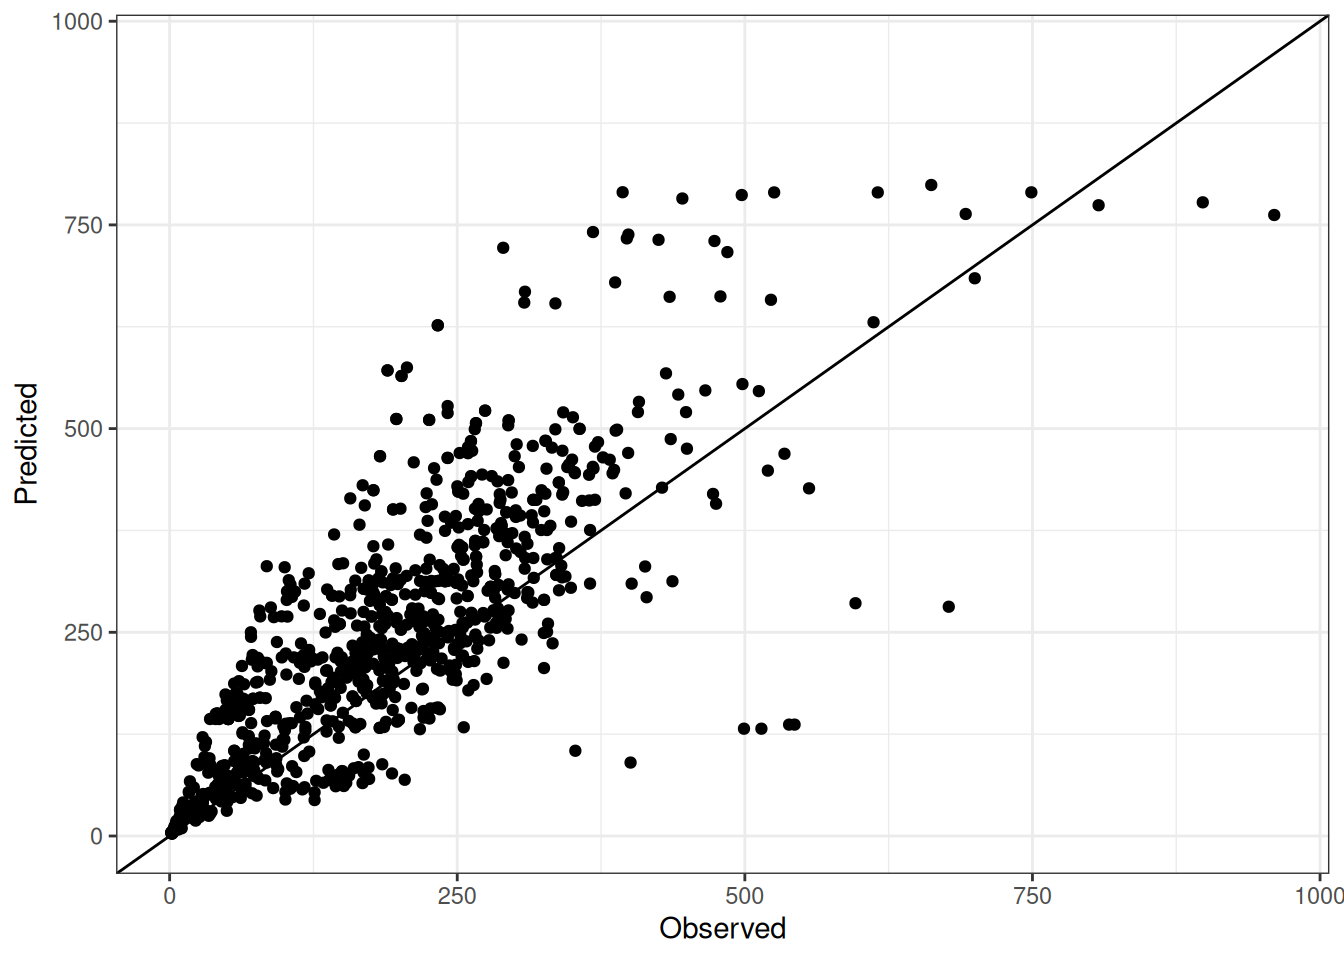
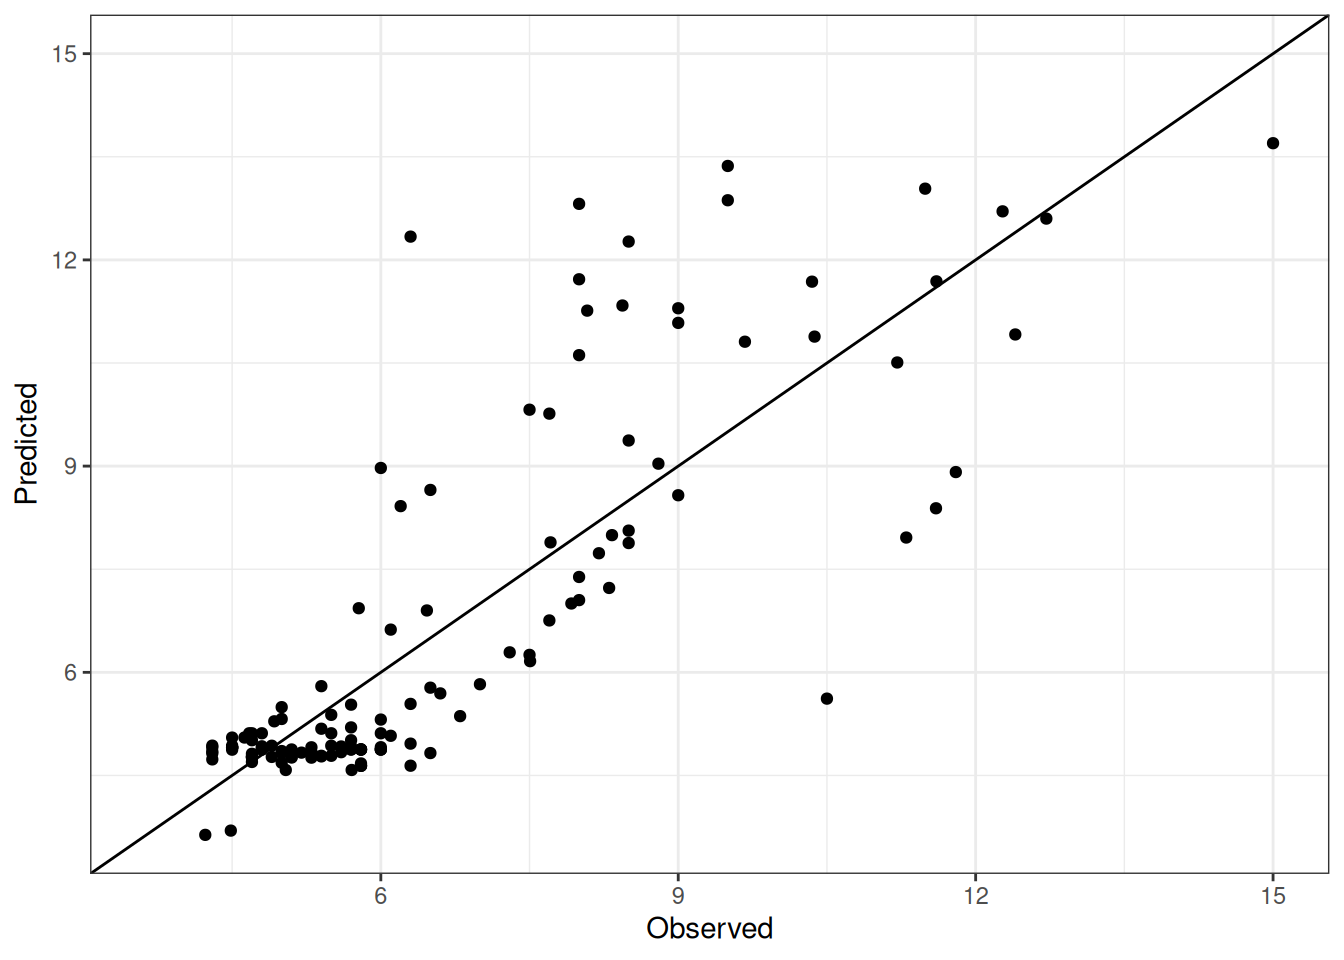
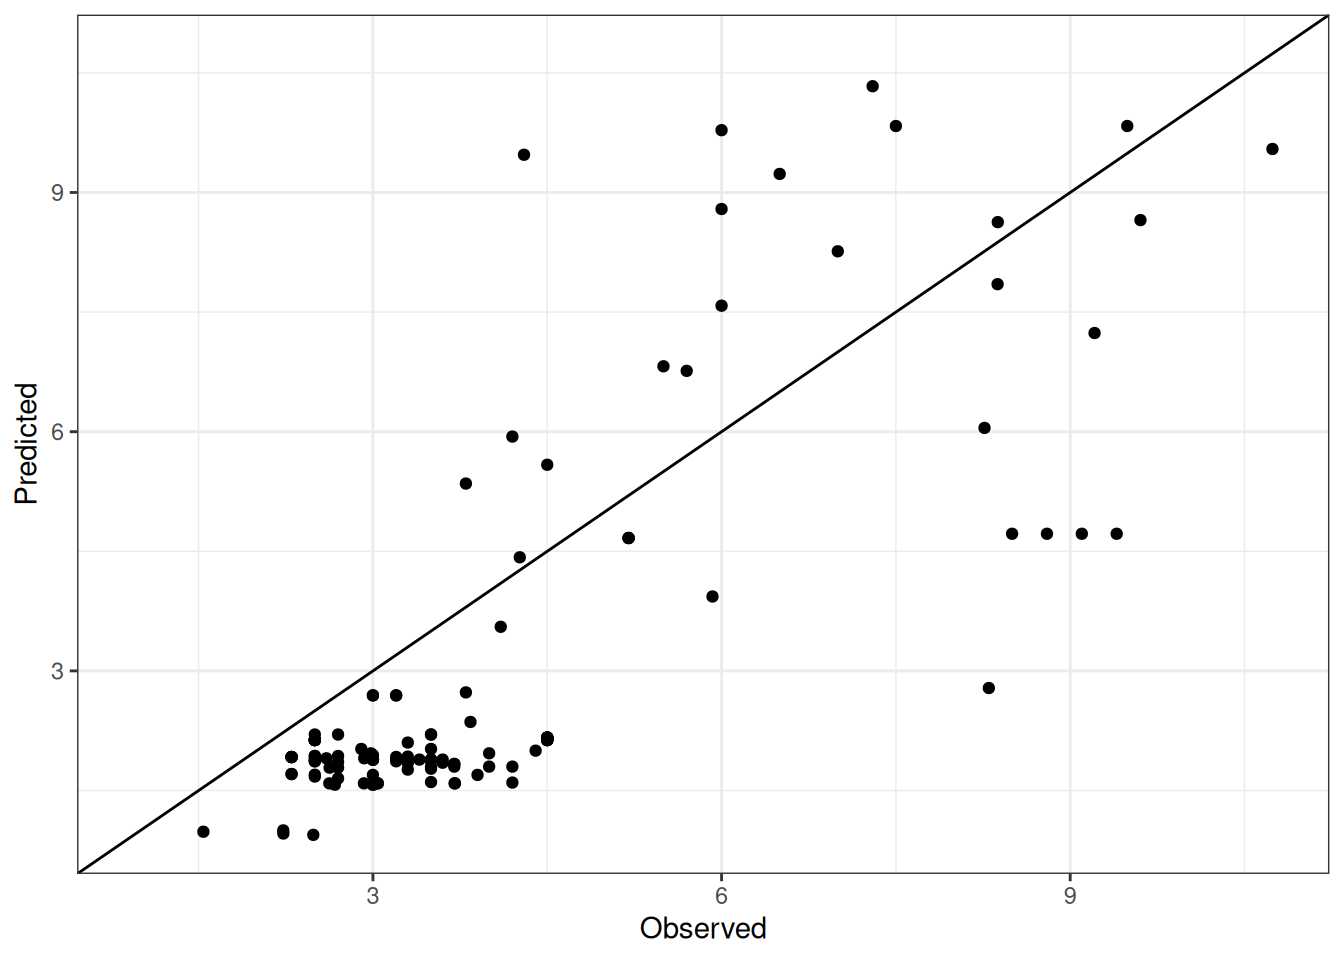
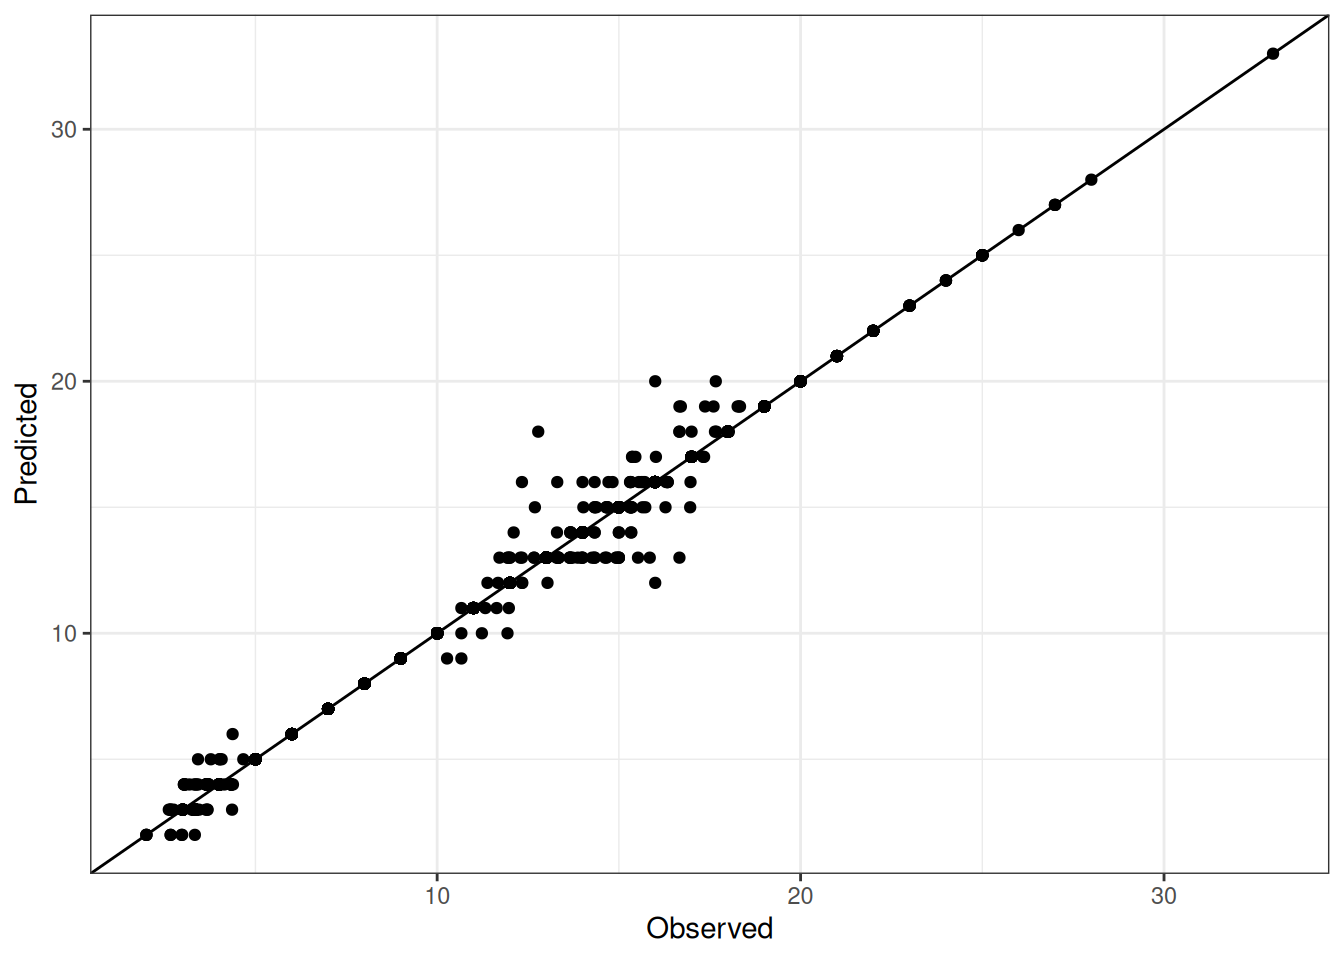
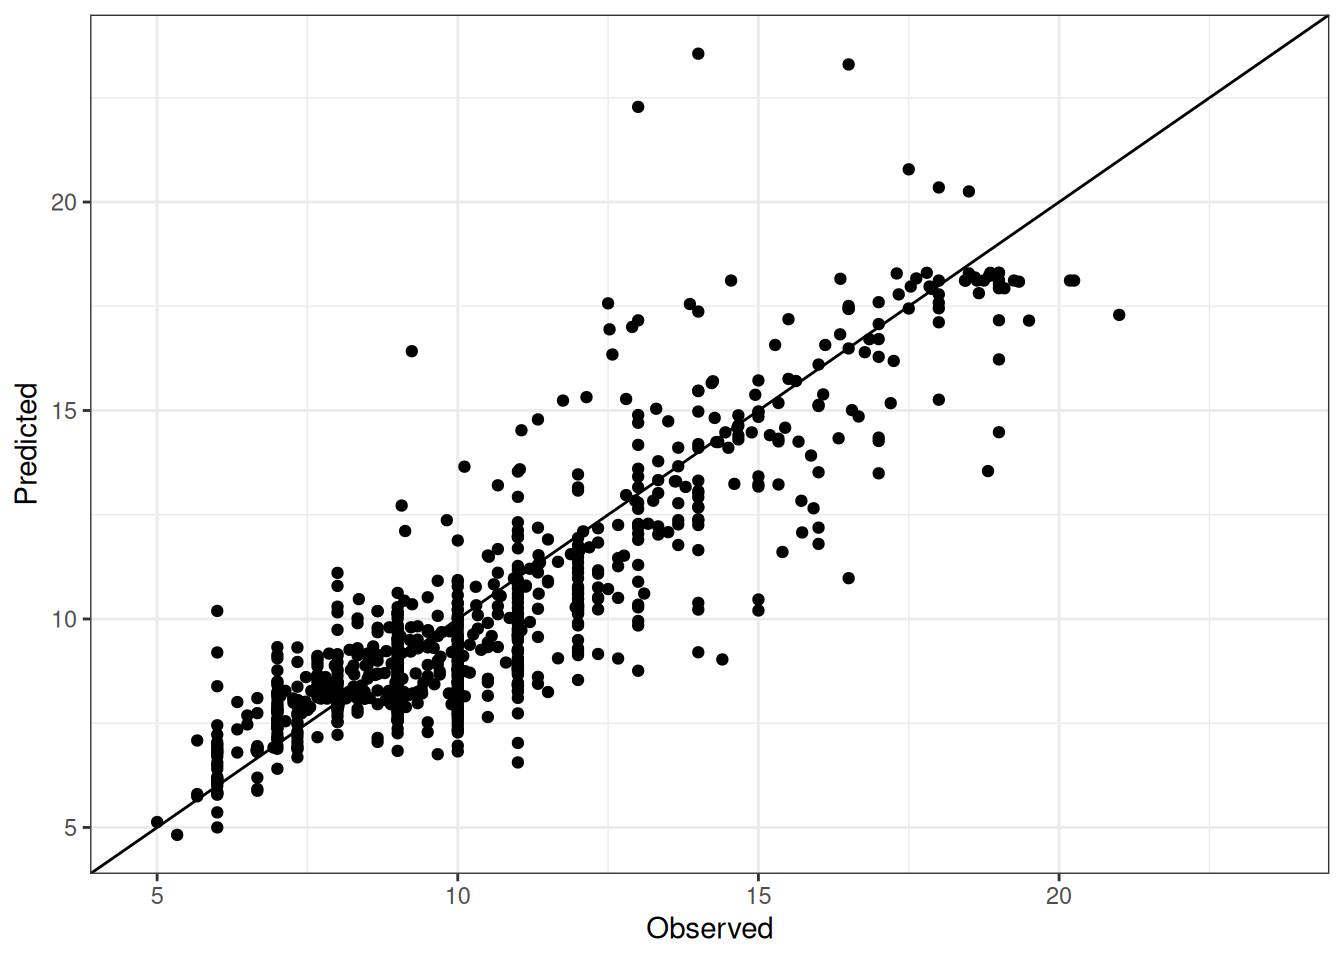
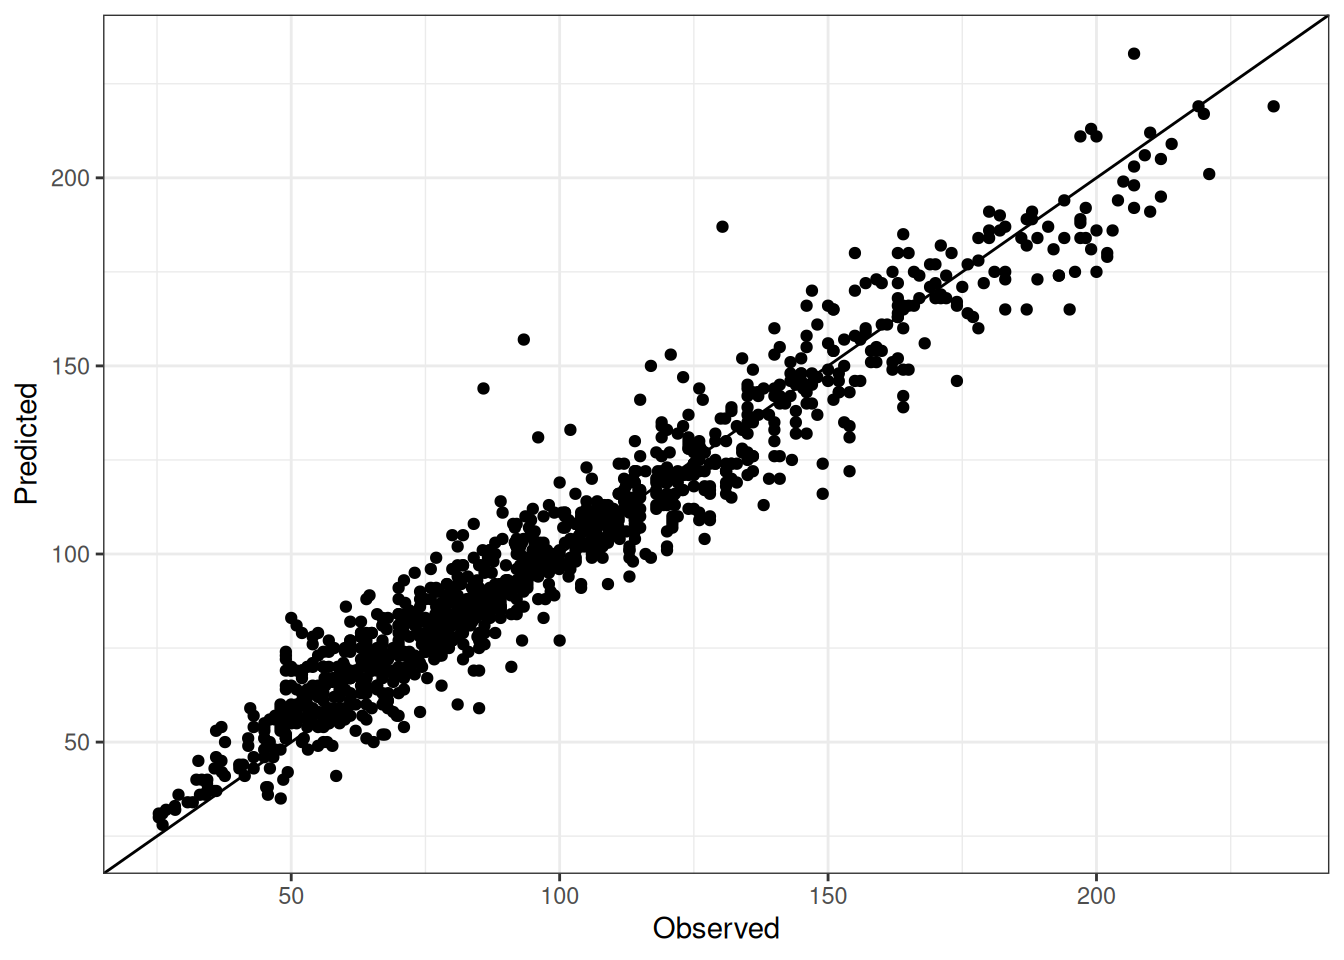
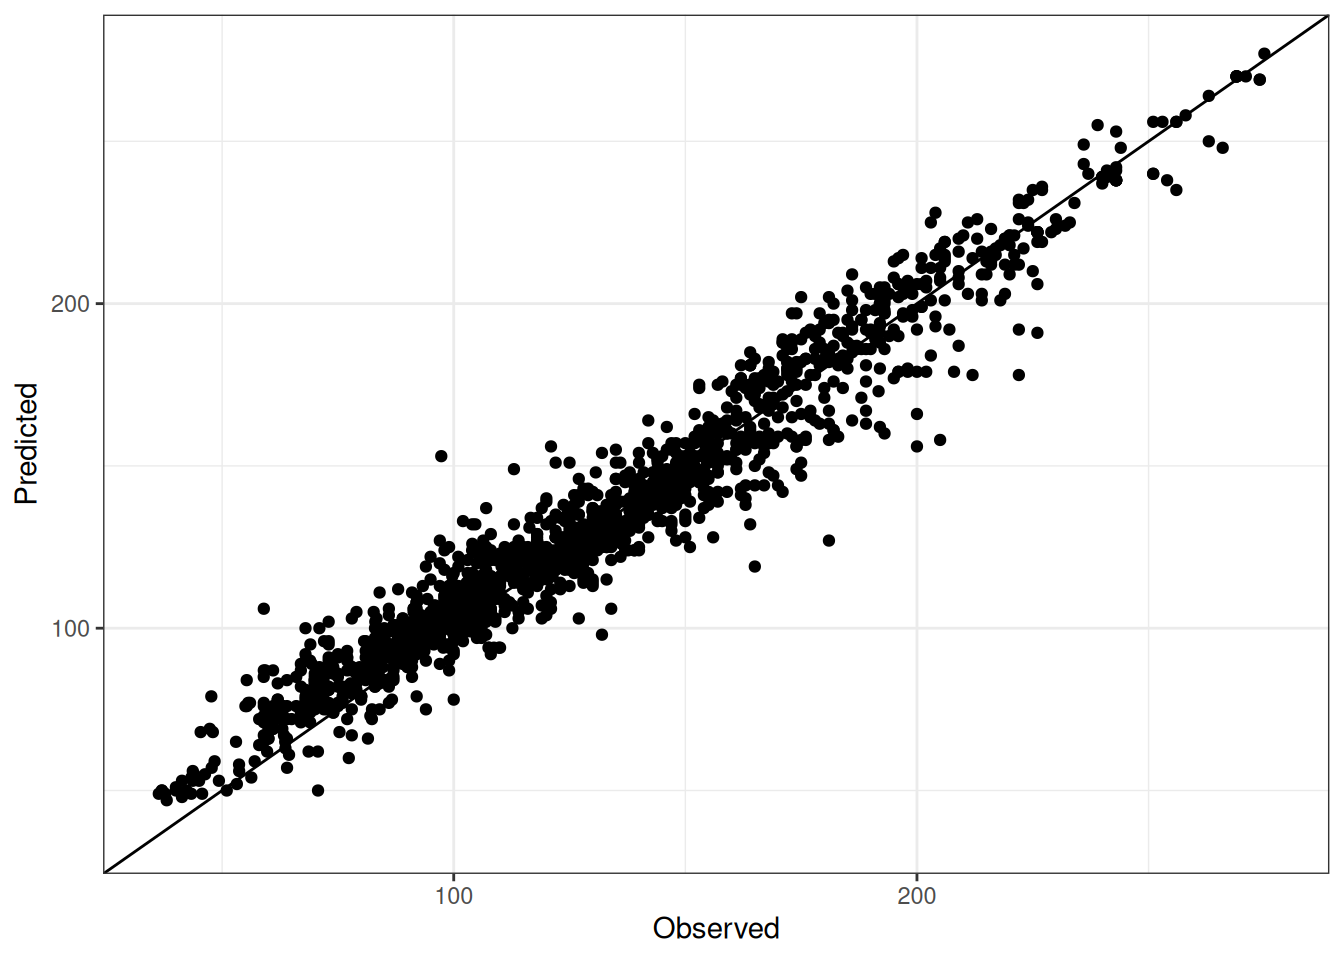
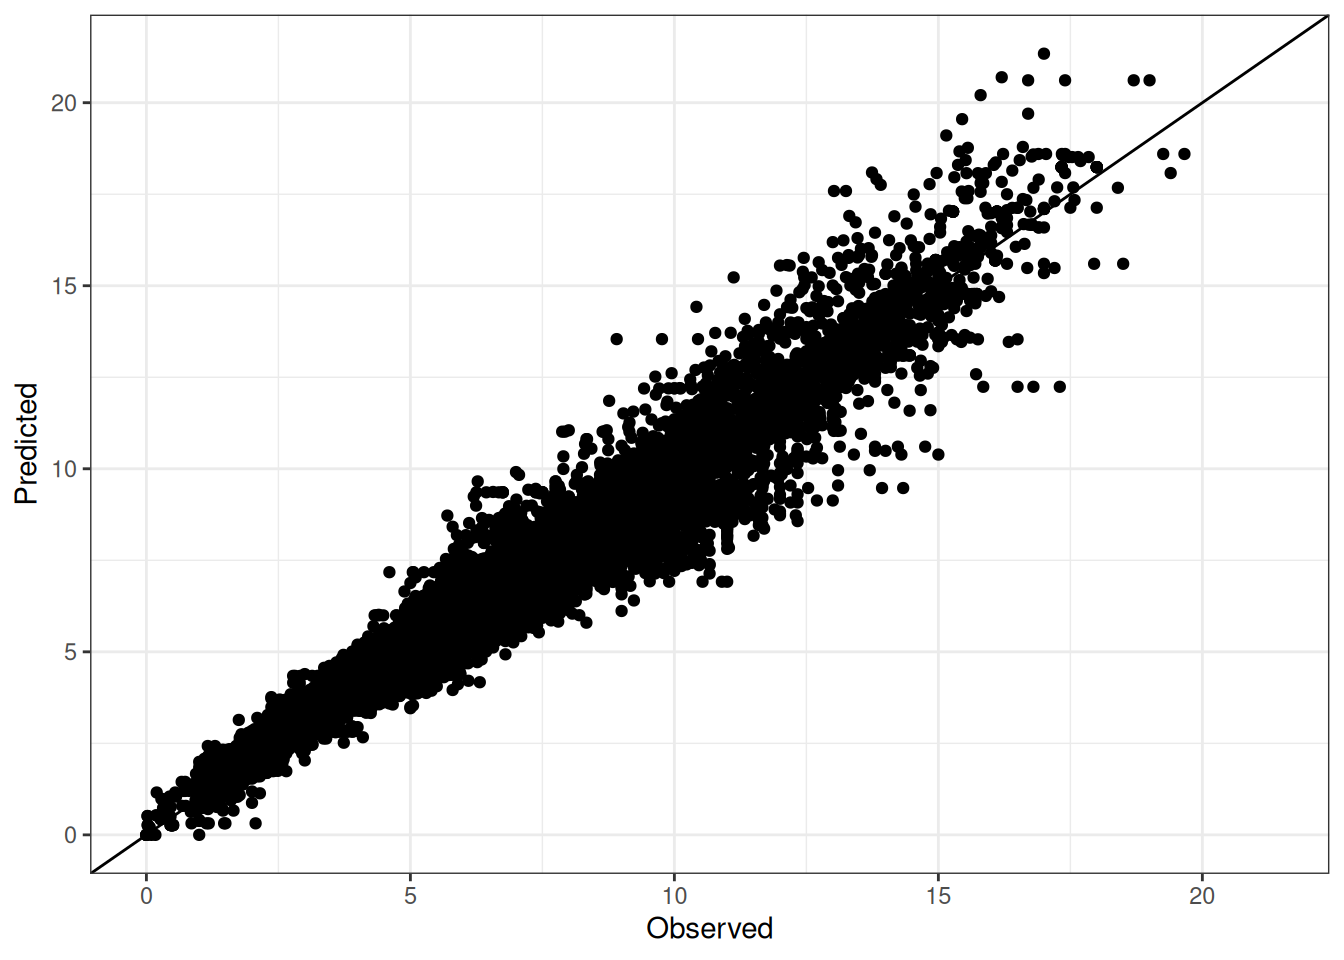
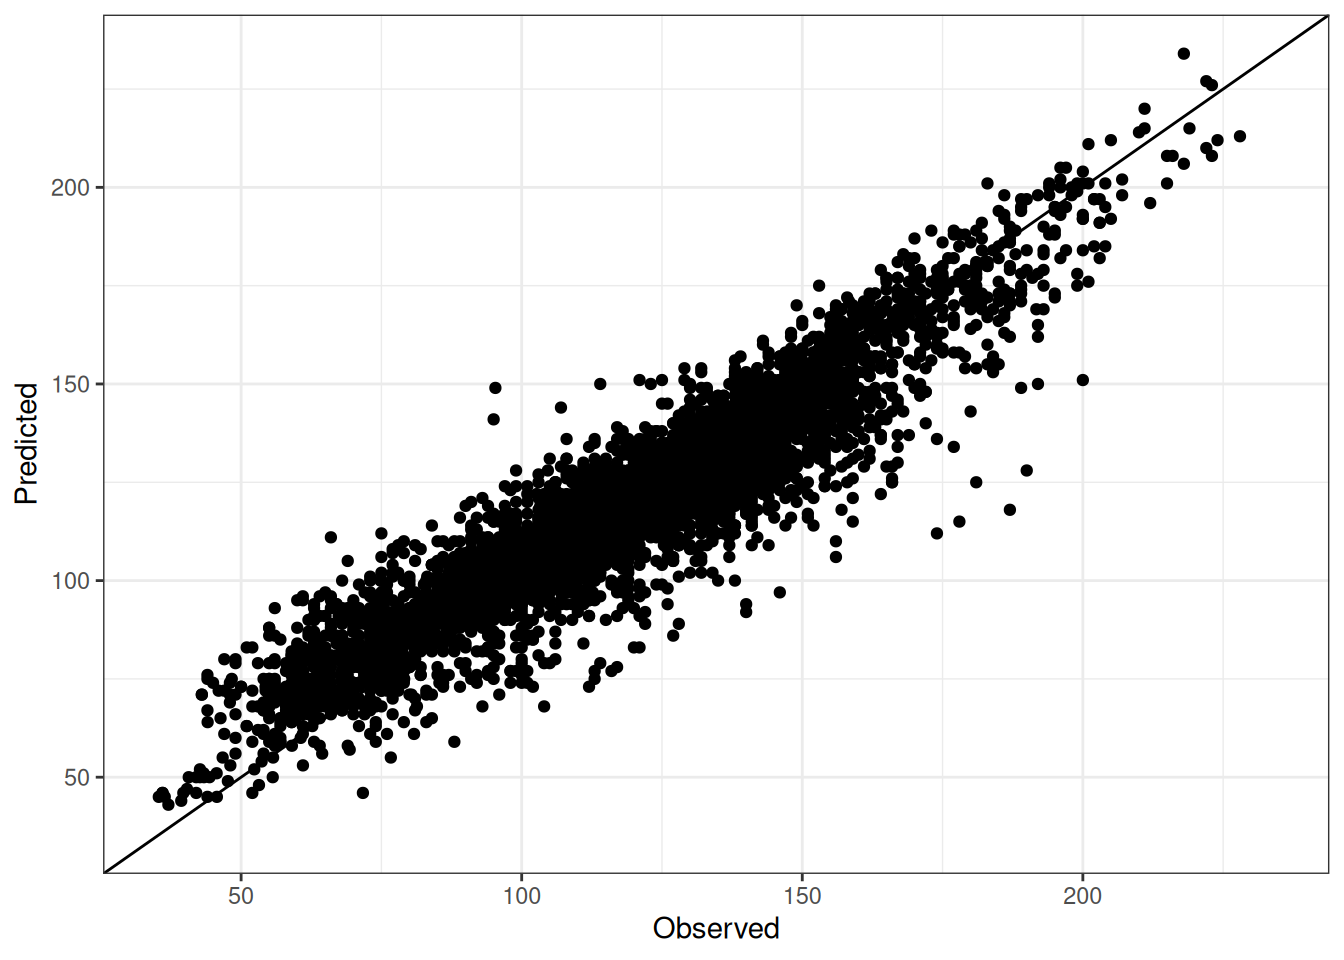
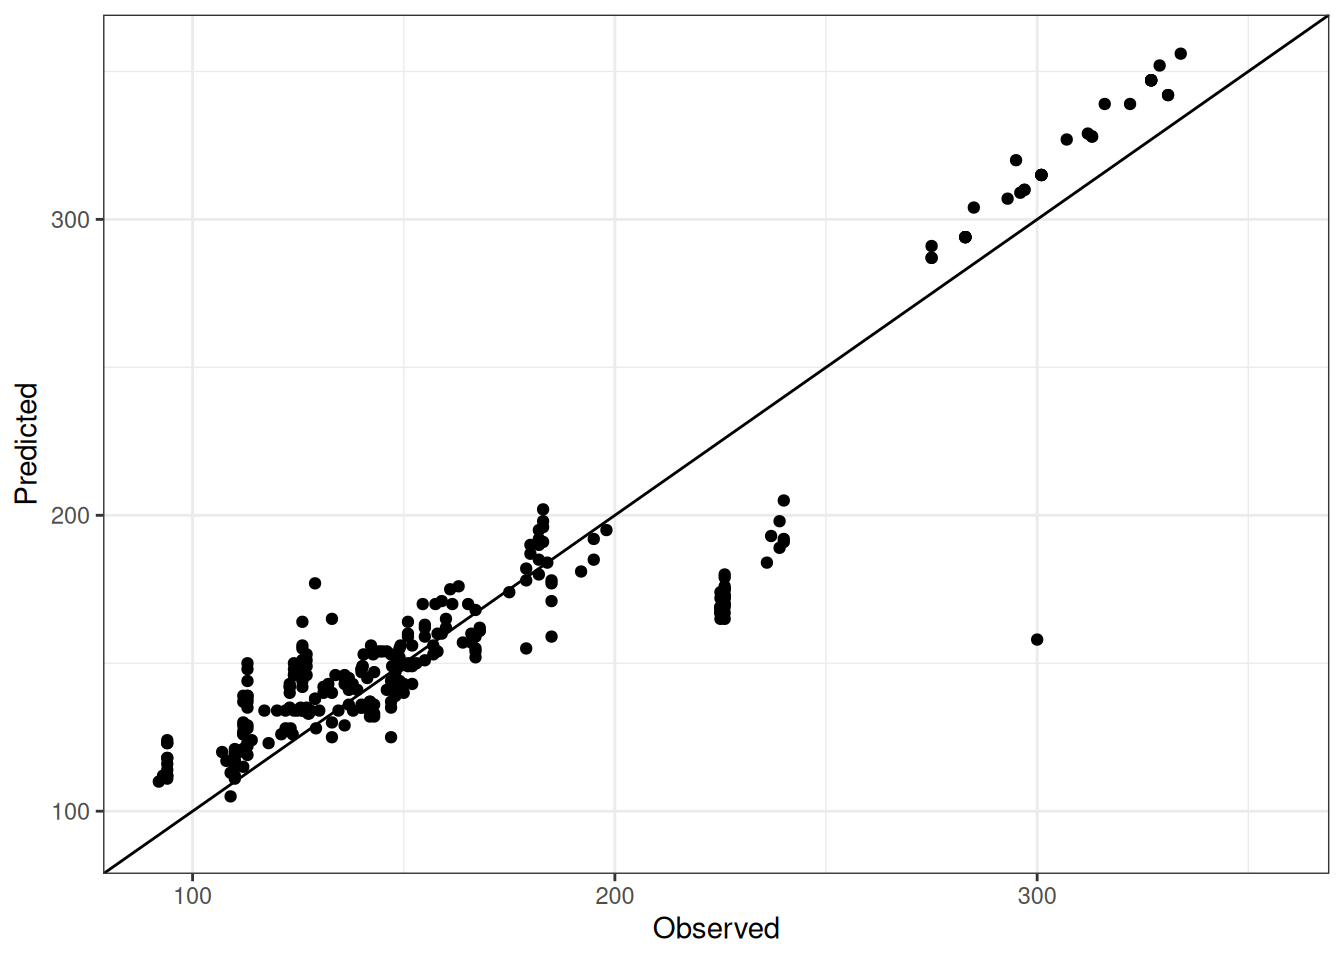
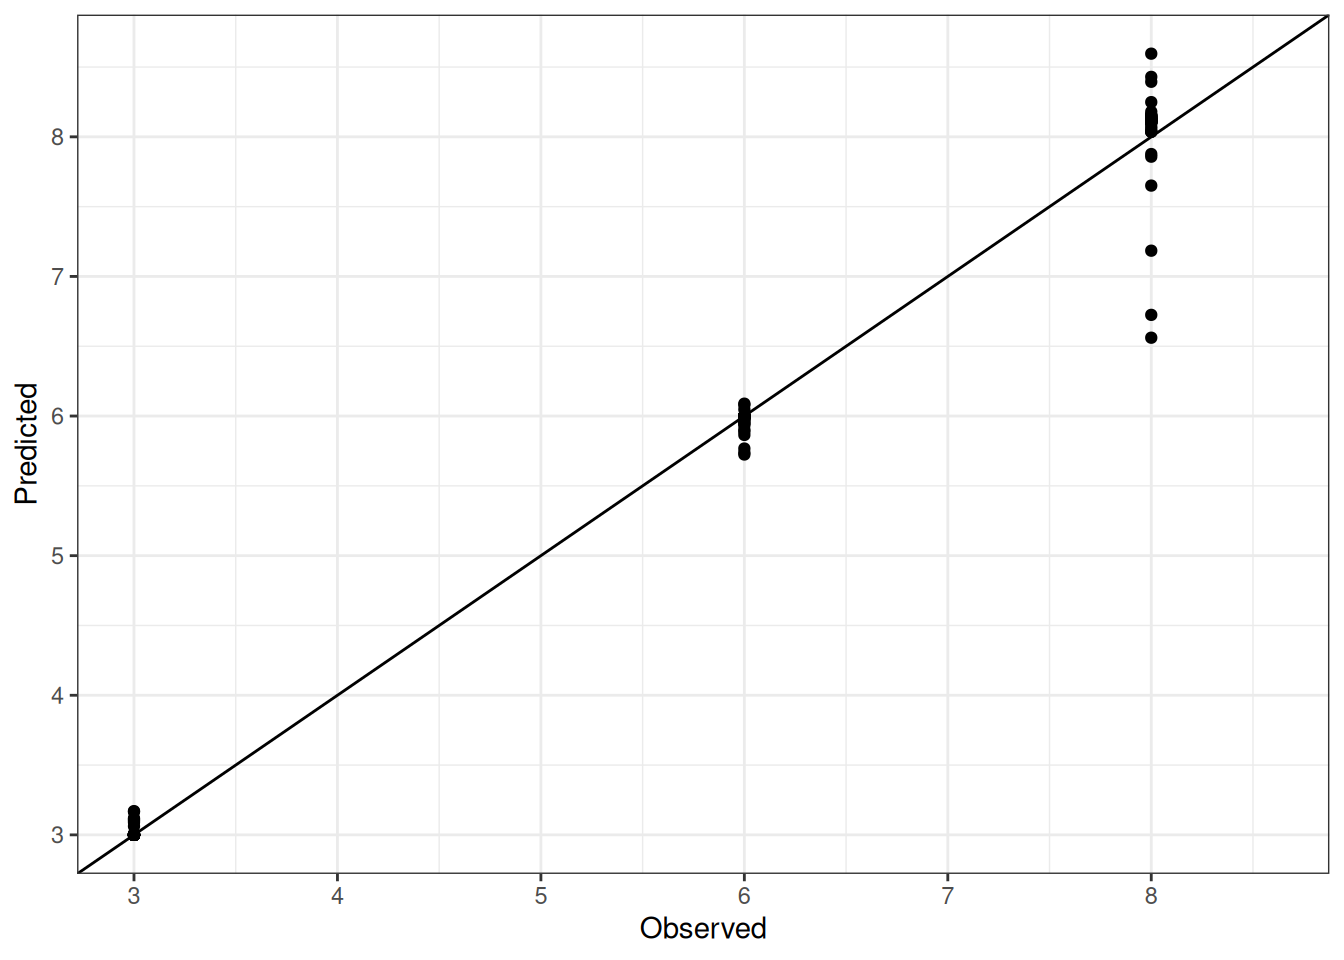
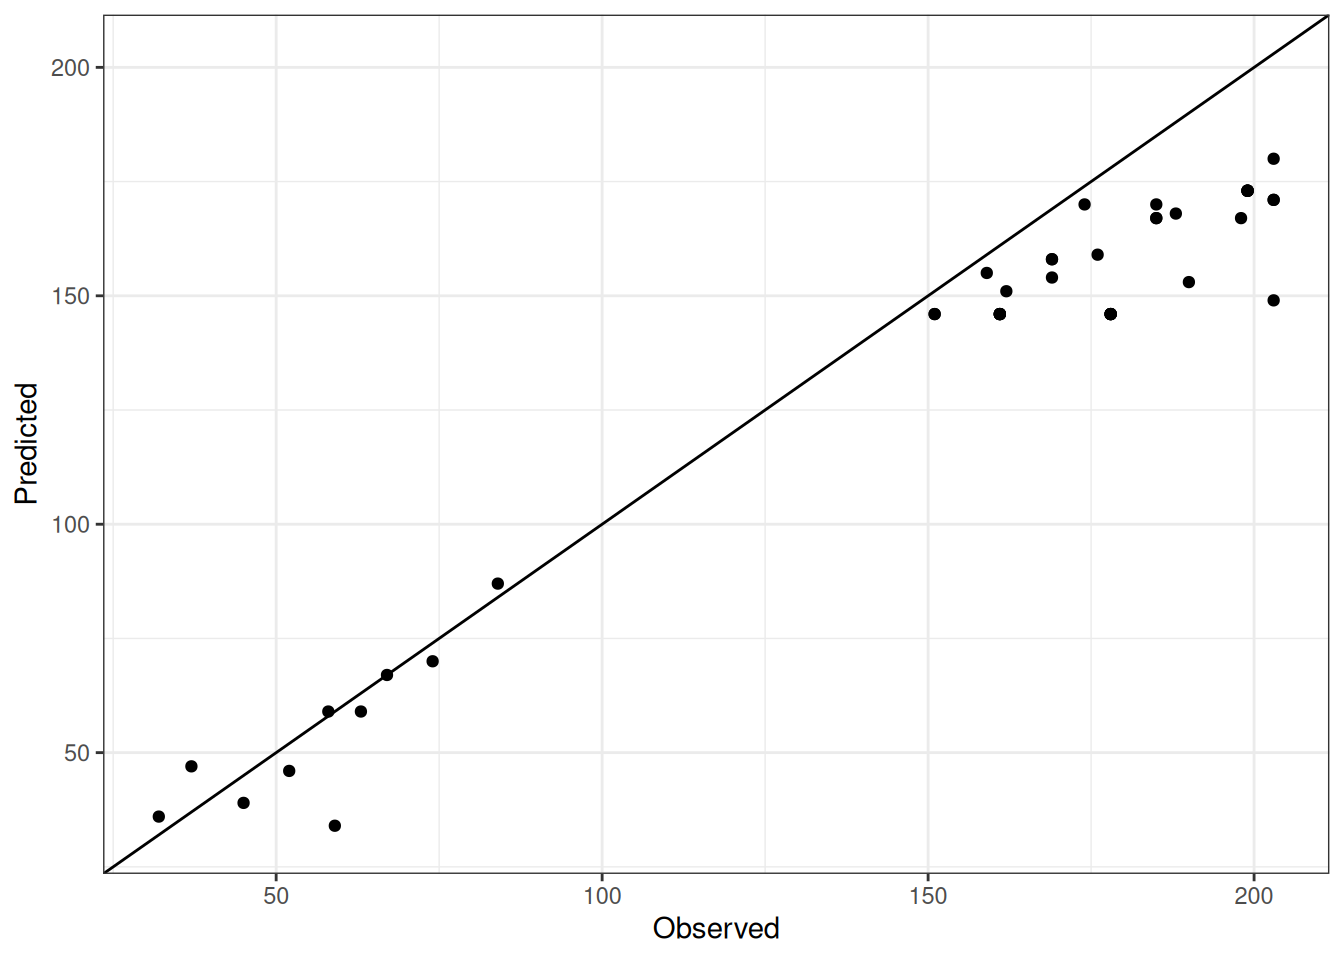
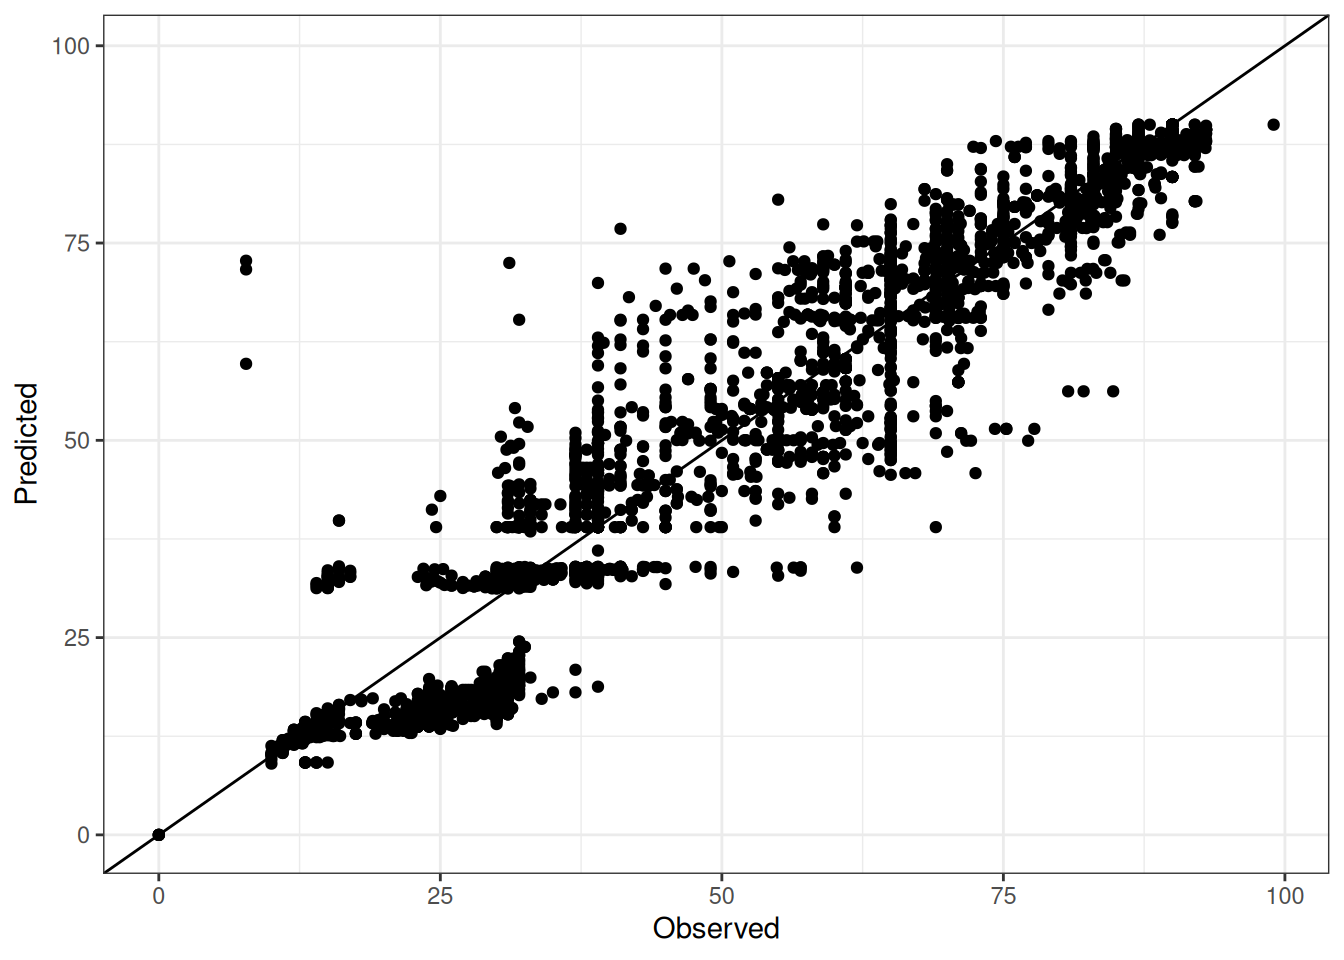
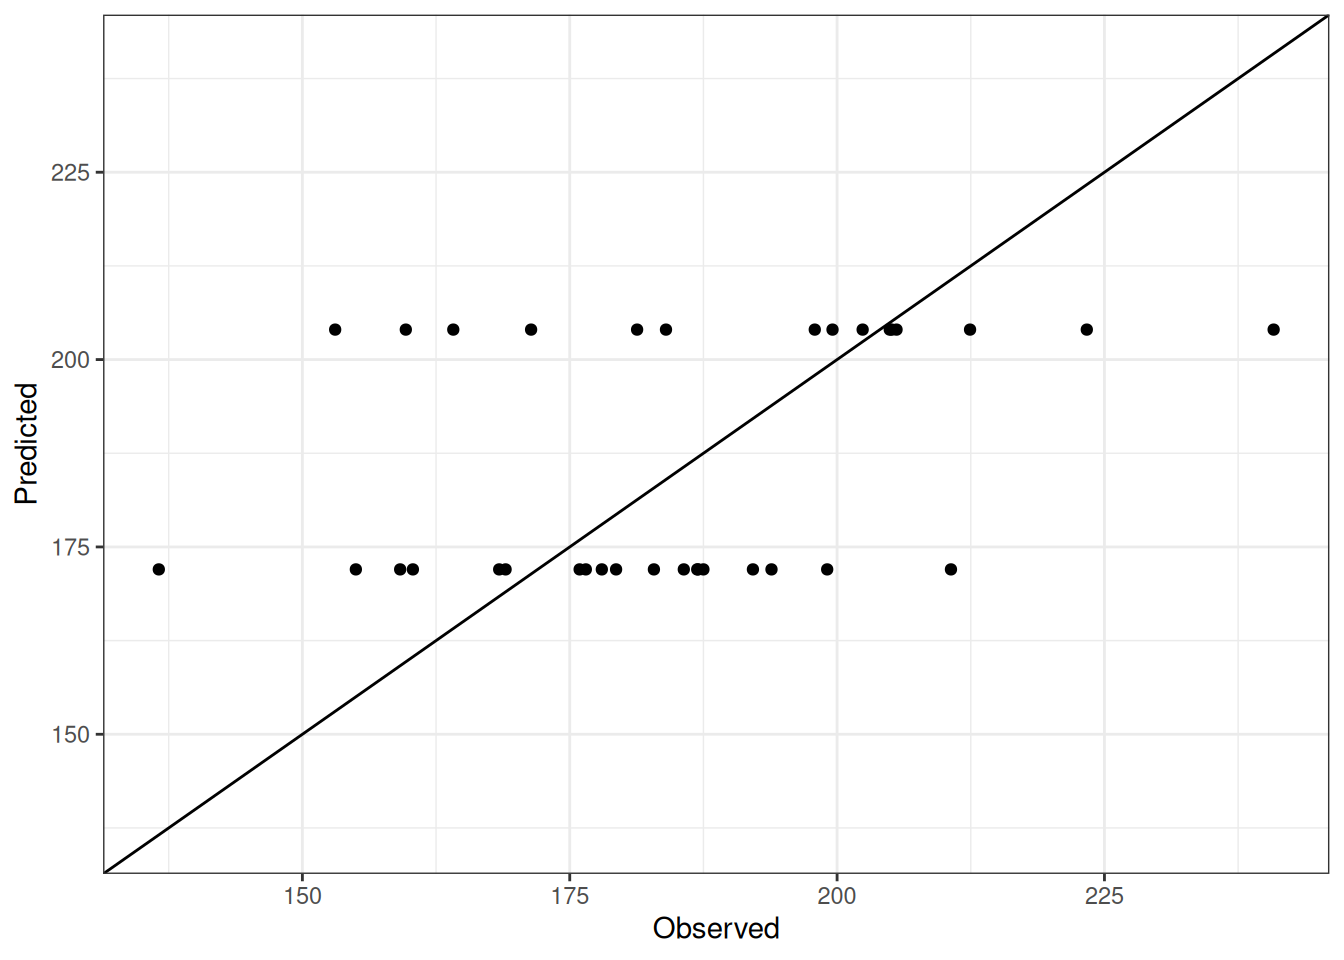
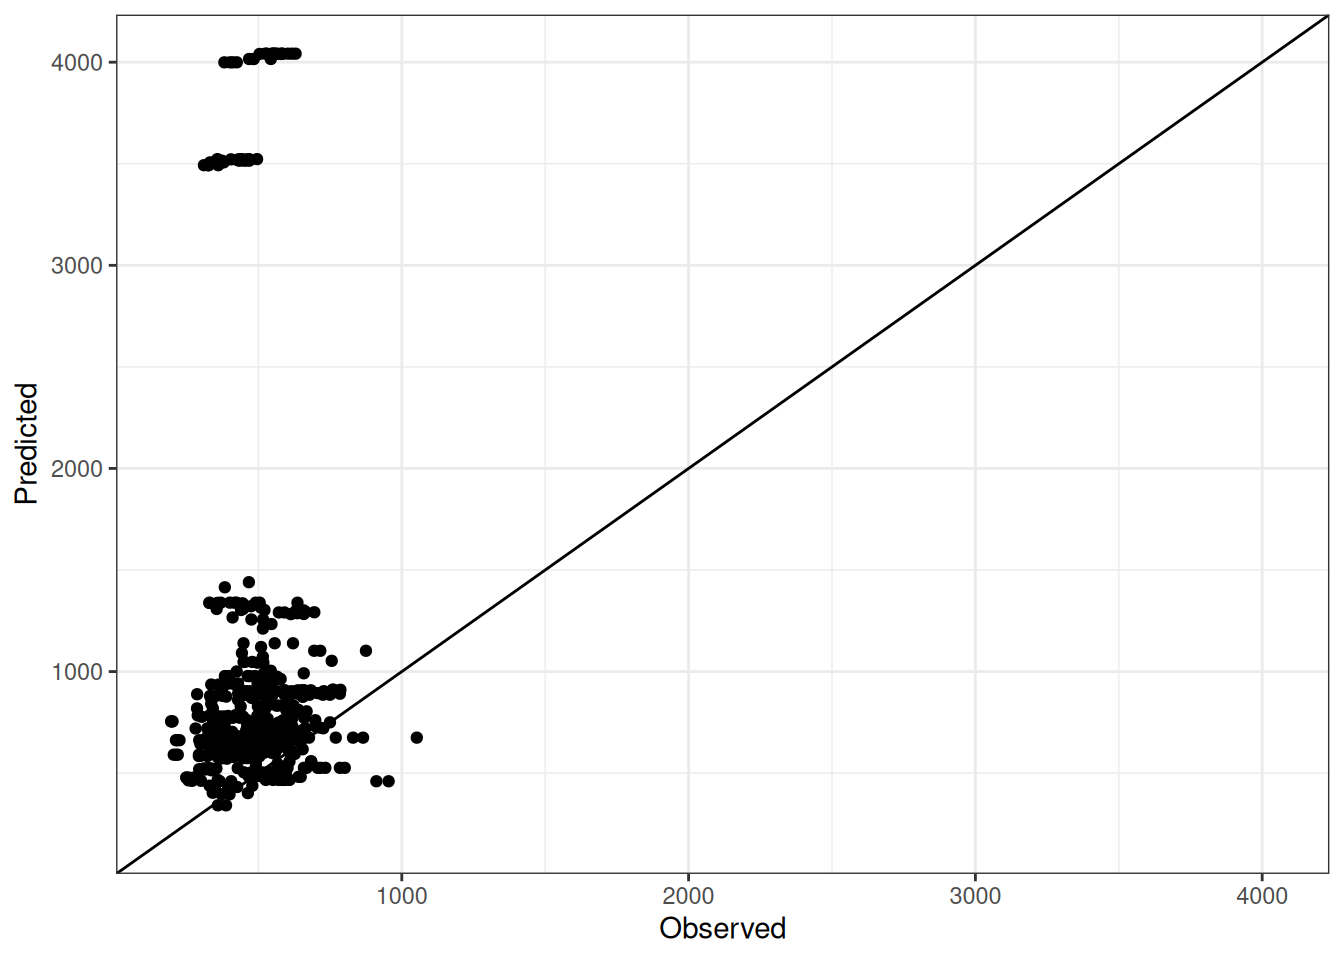
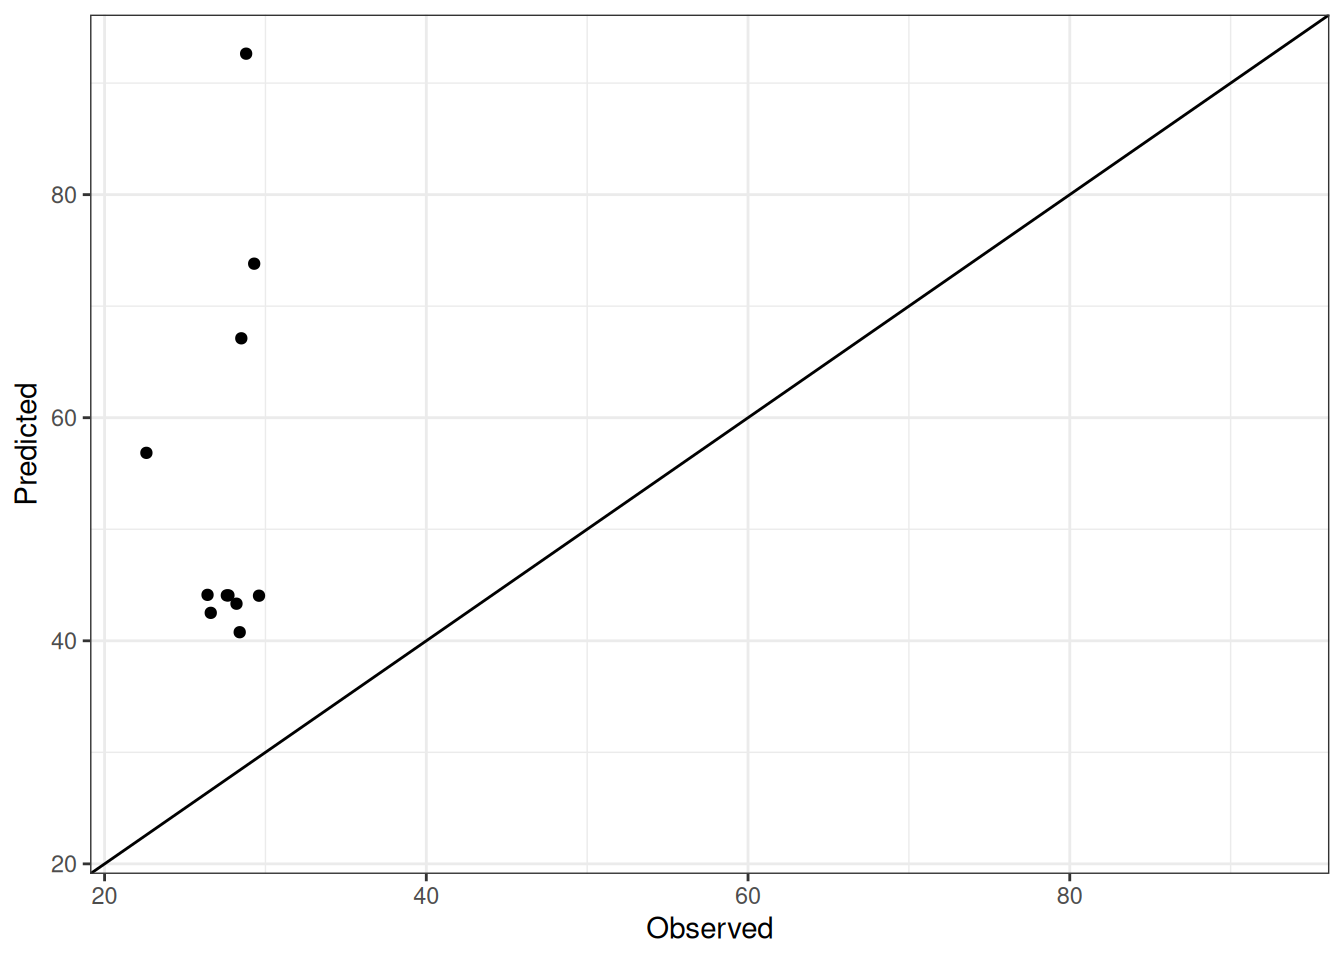
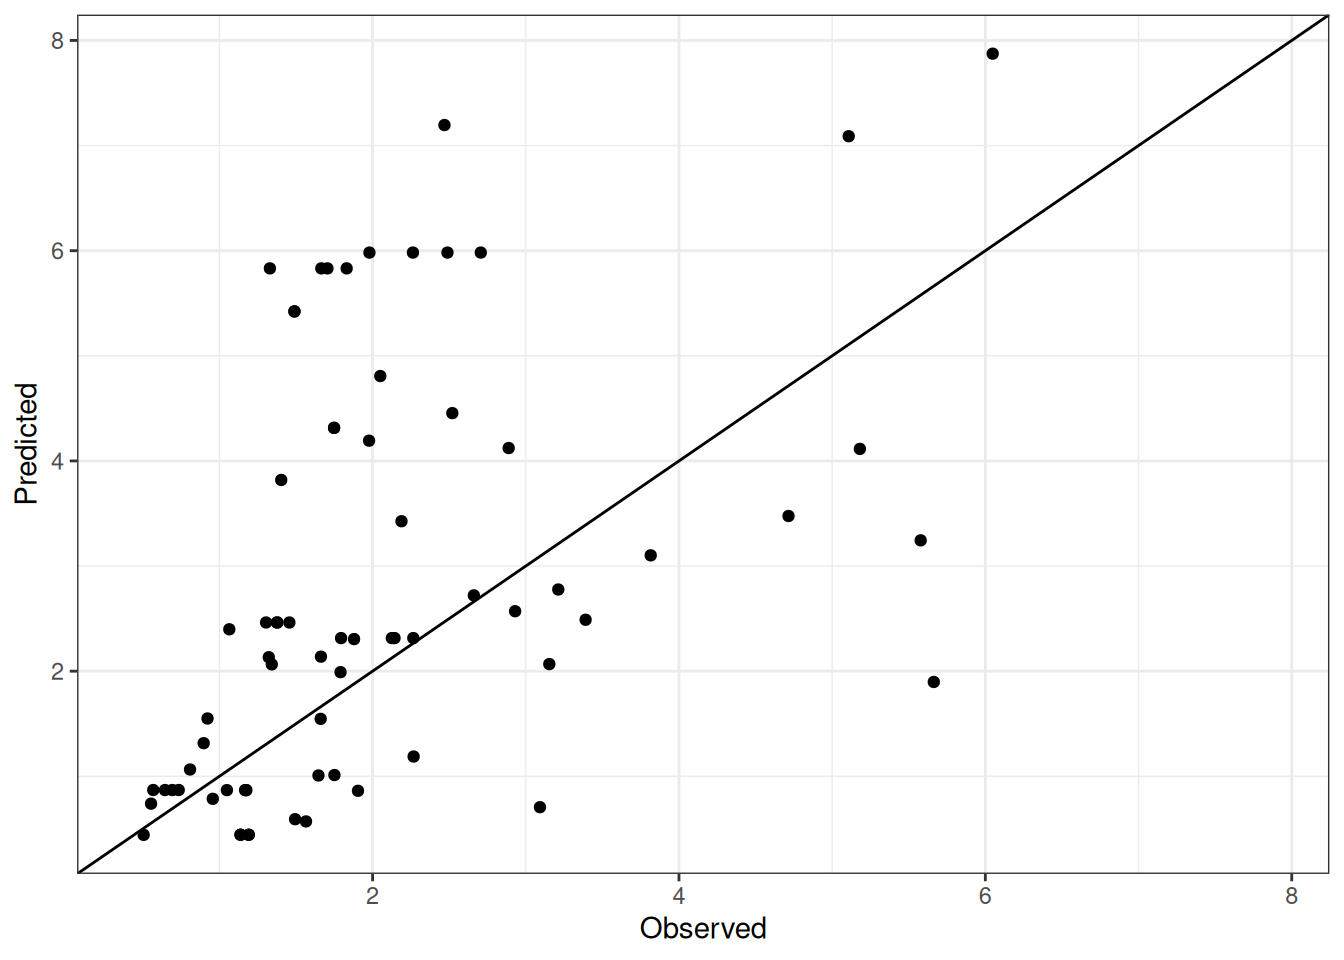
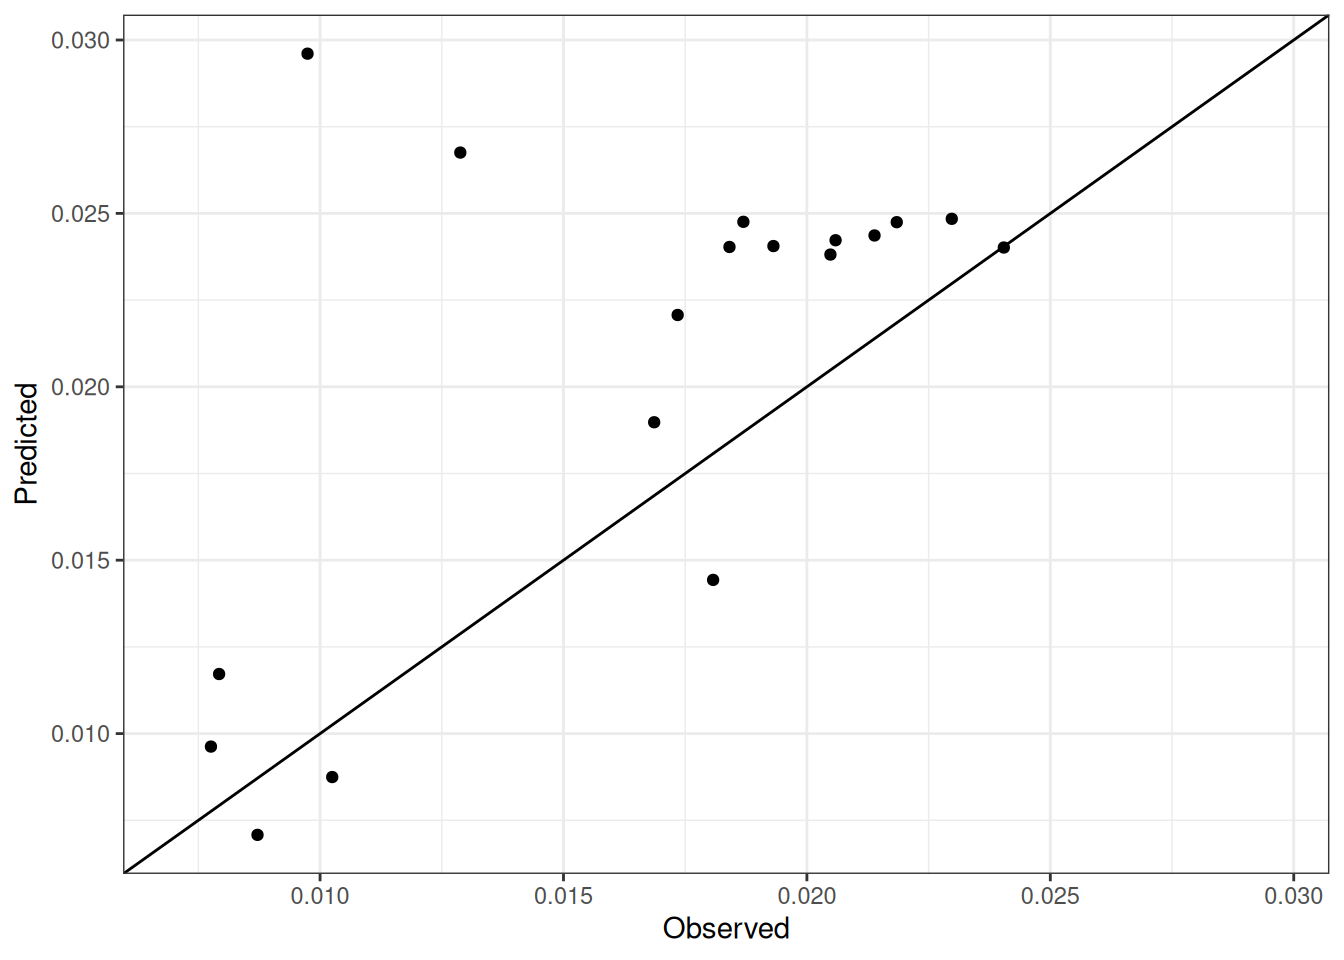
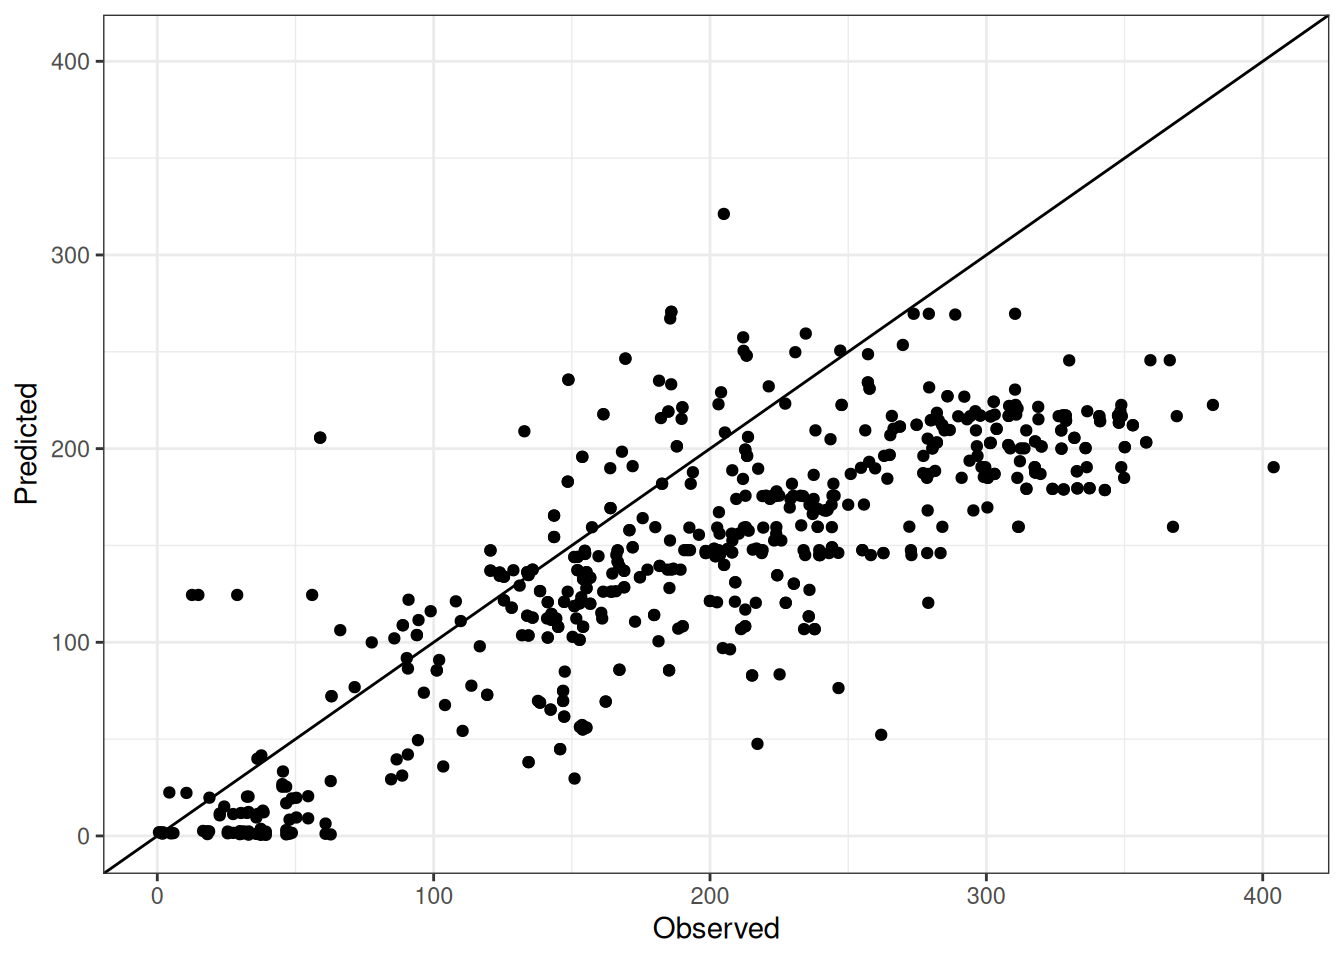
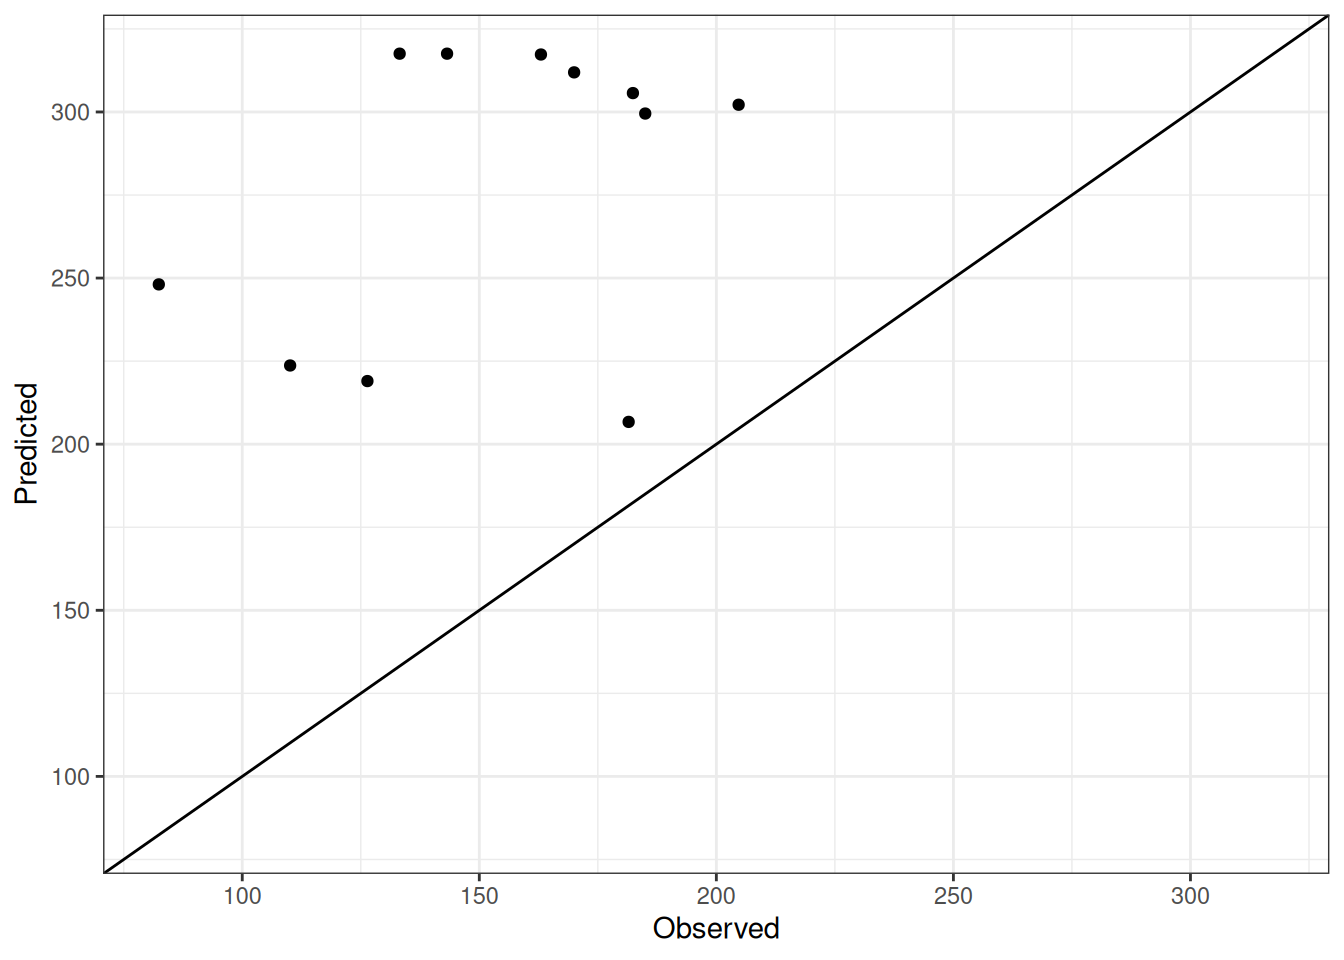
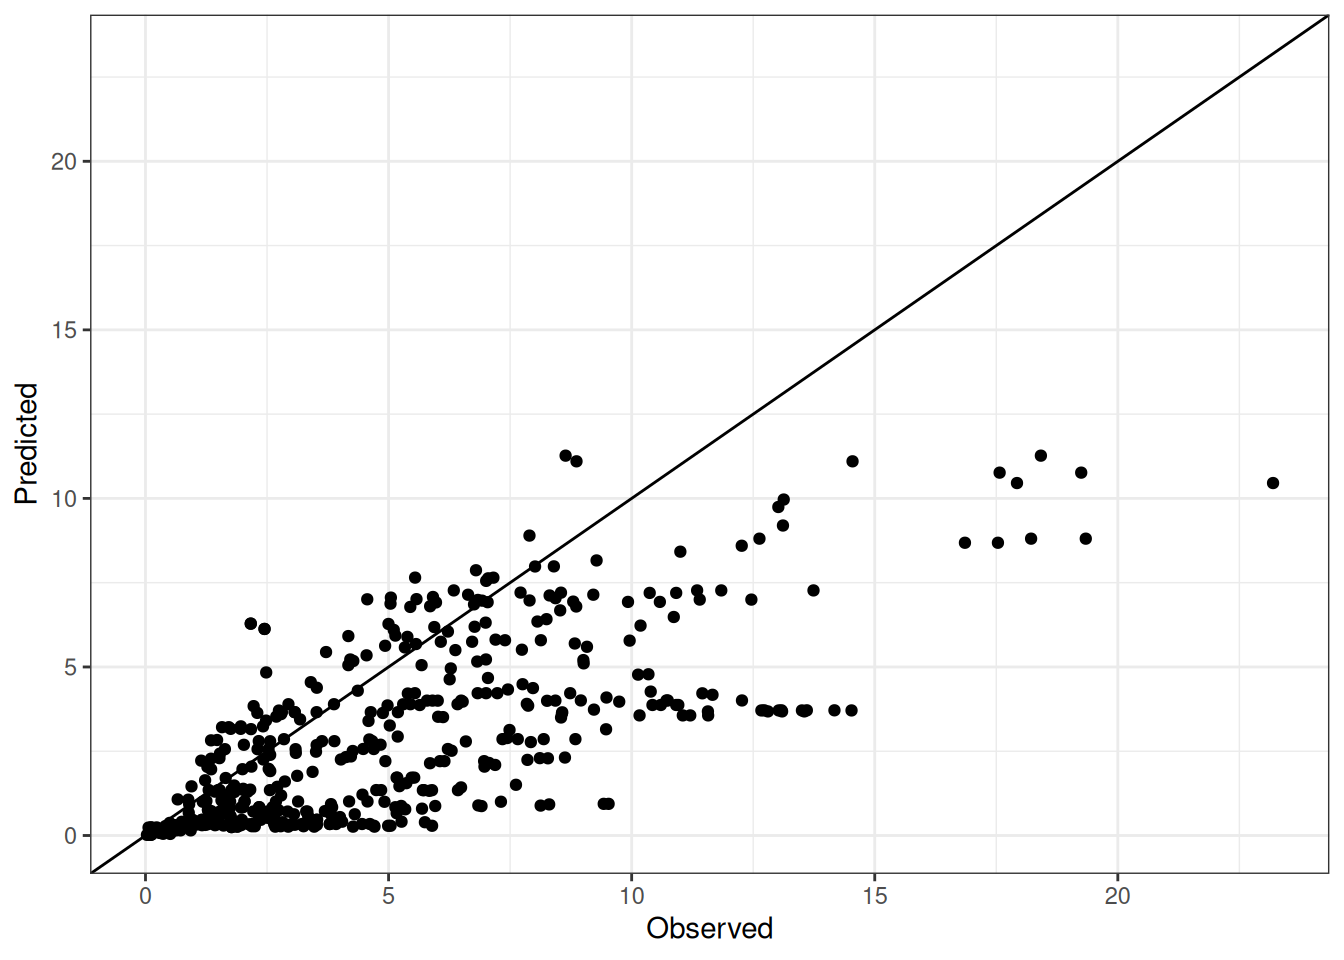
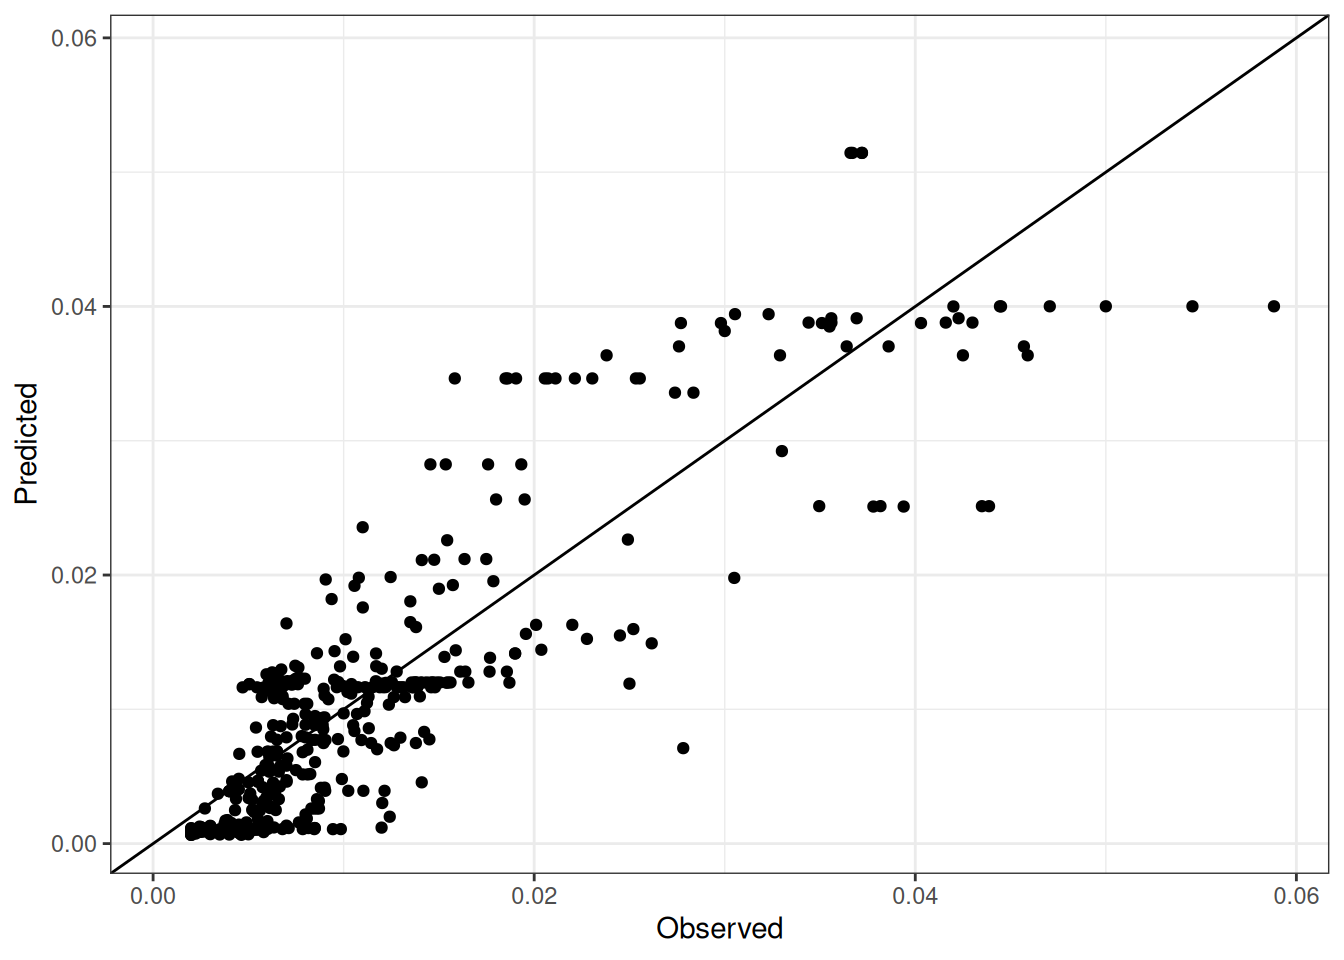
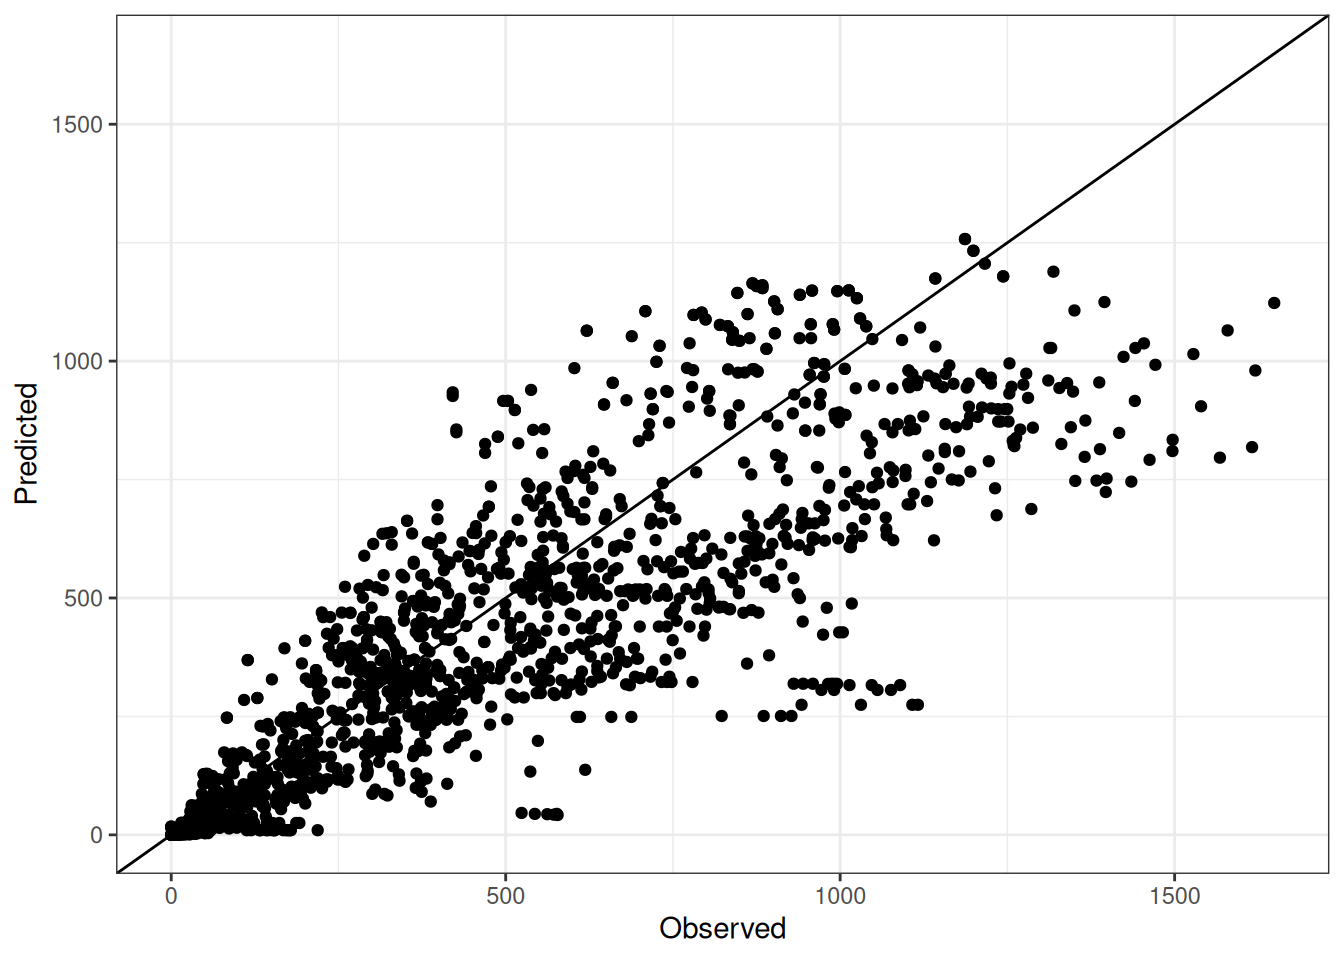
Comparison of observed and predicted values
The model performance is compared with observed and predicted values for all cultivars across all experiments. The plots below show the observed vs predicted values for different traits. Each point represents an observation from an experiment. The closer the points are to the diagonal line, the better the performance of the model for that trait.
The range of observed and predicted values are estimated using data in this page, which may be misleading for the narrow ranges of observed and predicted values.
Using the Expand All and Collapse All buttons below, you can expand or collapse the sections for each trait to see the observed vs predicted plots for different traits.
Note.Wheat.Leaf.Transpiration…ISoilWater.Es…MicroClimate.PrecipitationInterception.
NoteAboveGround.N
NoteAboveGround.NConc
NoteAboveGround.StorageWt
NoteAboveGround.Wt
NoteDaysAfterSowing
NoteEar.N
NoteEar.NConc
NoteEar.Wt
NoteEar.WtProportion
NoteGrain.N
NoteGrain.NConc
NoteGrain.Number
NoteGrain.Protein
NoteGrain.Size
NoteGrain.Wt
NoteLeaf.CoverGreen
NoteLeaf.CoverTotal
NoteLeaf.Dead.N
NoteLeaf.Dead.NConc
NoteLeaf.Dead.Wt
NoteLeaf.DeadWtProportion
NoteLeaf.Height
NoteLeaf.LAI
NoteLeaf.Live.N
NoteLeaf.Live.NConc
NoteLeaf.Live.StorageWt
NoteLeaf.Live.Wt
NoteLeaf.LiveWtProportion
NoteLeaf.N
NoteLeaf.SpecificAreaCanopy
NoteLeaf.StemNumberPerPlant
NoteLeaf.StemPopulation
NoteLeaf.Wt
NotePhenology.CAMP.TSHS
NotePhenology.CAMP.VSHS
NotePhenology.EmergenceDAS
NotePhenology.FinalLeafNumber
NotePhenology.FlagLeafDAS
NotePhenology.FloweringDAS
NotePhenology.HaunStage
NotePhenology.HeadingDAS
NotePhenology.MaturityDAS
NotePhenology.Stage
NotePhenology.TerminalSpikeletDAS
NotePhenology.Zadok.Stage
NotePopulation
NoteSpike.HeadNumber
NoteSpike.Live.StorageWt
NoteSpike.N
NoteSpike.NConc
NoteSpike.Wt
NoteStem.Live.StorageWt
NoteStem.N
NoteStem.NConc
NoteStem.Wt
NoteStem.WtProportion